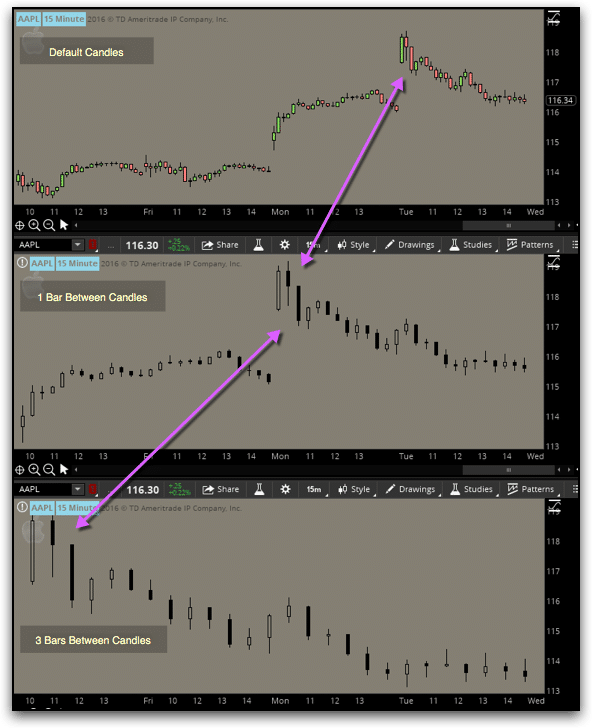
I was recently asked how to programmatically add space between the candles on a chart. This is what I initially came up with.
# +--------------------------------------------------+
# |        Example: Add Space Between Candles        |
# |                   Robert Payne                   |
# |               rrpayne.blogspot.com               |
# +--------------------------------------------------+
# hide the default candles
HidePricePlot();

# how many bars do you want between candles?
input BarsBetween = 1;

# calculate the offset
def lastBar = HighestAll(if !isNaN(close) then BarNumber() else 0);
def offset = BarsBetween * ((lastBar - BarNumber()) / (BarsBetween + 1));

# build the candles
def o;
def h;
def l;
def c;
if offset % 1 == 0 then {
    o = GetValue(open, -offset);
    h = GetValue(high, -offset);
    l = GetValue(low, -offset);
    c = GetValue(close, -offset);
} else {
    o = Double.NaN;
    h = Double.NaN;
    l = Double.NaN;
    c = Double.NaN;
}

# Plot the new Chart
AddChart(high = h, low = l, open = o, close = c, type = ChartType.CANDLE, growcolor = color.black);
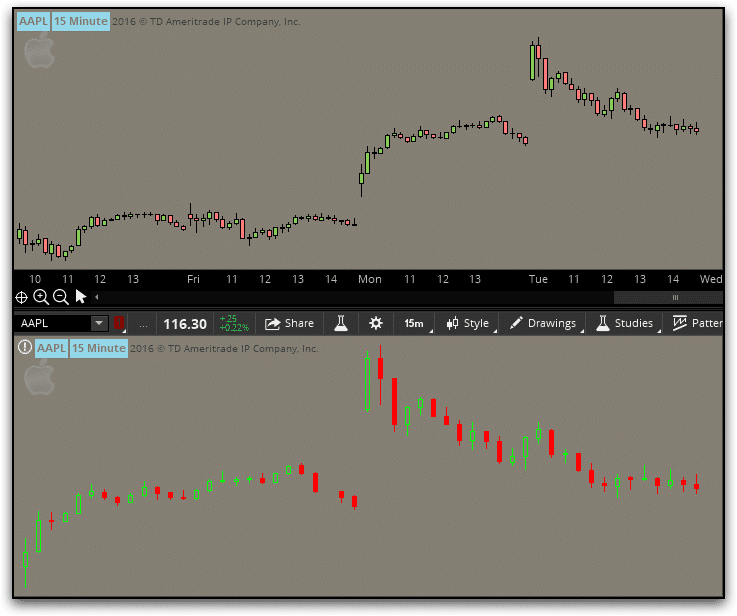
In the above image, you’ll notice that the candles we plotted ourselves are only black. That is because the AddChart() function was deprecated a few years ago and is no longer fully supported. i.e.—While it used to allow for different colors to be used for up, down, or neutral candles; it no longer does.
However, with a little creative thinking, we can still have colored candles.
# +--------------------------------------------------+
# |      Example: Add Space Between Candles rev 1    |
# |                   Robert Payne                   |
# |               rrpayne.blogspot.com               |
# +--------------------------------------------------+
declare lower;
# hide the default candles
HidePricePlot();

# how many bars do you want between candles?
input BarsBetween = 1;

# calculate the offset
def lastBar = HighestAll(if !IsNaN(close) then BarNumber() else 0);
def offset = BarsBetween * ((lastBar - BarNumber()) / (BarsBetween + 1));

# build the candle
def o;
def h;
def l;
def c;
if offset % 1 == 0
then {
    o = GetValue(open, -offset);
    h = GetValue(high, -offset);
    l = GetValue(low, -offset);
    c = GetValue(close, -offset);
} else {
    o = Double.NaN;
    h = Double.NaN;
    l = Double.NaN;
    c = Double.NaN;
}

# just the UP candles
def UpO;
def UpH;
def UpL;
def UpC;
if o <= c
then {
    UpO = o;
    UpH = h;
    UpL = l;
    UpC = c;
} else {
    UpO = Double.NaN;
    UpH = Double.NaN;
    UpL = Double.NaN;
    UpC = Double.NaN;
}

# just the DOWN candles
def DnO;
def DnH;
def DnL;
def DnC;
if o > c
then {
    DnO = o;
    DnH = h;
    DnL = l;
    DnC = c;
} else {
    DnO = Double.NaN;
    DnH = Double.NaN;
    DnL = Double.NaN;
    DnC = Double.NaN;
}

# Plot the new Chart
AddChart(high = uph, low = upl, open = upo, close = upc, type = ChartType.CANDLE, growcolor = color.green);
AddChart(high = dnh, low = dnl, open = dno, close = dnc, type = ChartType.CANDLE, growcolor = color.red);
That is certainly an improvement, but I still think we can do better.
# +--------------------------------------------------+
# |      Example: Add Space Between Candles rev 2    |
# |                   Robert Payne                   |
# |               rrpayne.blogspot.com               |
# +--------------------------------------------------+
declare lower;
# hide the default candles
HidePricePlot();

# how many bars do you want between candles?
input BarsBetween = 1;

# calculate the offset
def lastBar = HighestAll(if !IsNaN(close) then BarNumber() else 0);
def offset = BarsBetween * ((lastBar - BarNumber()) / (BarsBetween + 1));

# build the candle
def o;
def h;
def l;
def c;
if offset % 1 == 0
then {
    o = GetValue(open, -offset);
    h = GetValue(high, -offset);
    l = GetValue(low, -offset);
    c = GetValue(close, -offset);
} else {
    o = Double.NaN;
    h = Double.NaN;
    l = Double.NaN;
    c = Double.NaN;
}

# just the UP candles
def UpO;
def UpH;
def UpL;
def UpC;
if o <= c
then {
    UpO = o;
    UpH = h;
    UpL = l;
    UpC = c;
} else {
    UpO = Double.NaN;
    UpH = Double.NaN;
    UpL = Double.NaN;
    UpC = Double.NaN;
}

# just the DOWN candles
def DnO;
def DnH;
def DnL;
def DnC;
if o > c
then {
    DnO = o;
    DnH = h;
    DnL = l;
    DnC = c;
} else {
    DnO = Double.NaN;
    DnH = Double.NaN;
    DnL = Double.NaN;
    DnC = Double.NaN;
}

# Plot the new Chart
# solid green (note that the open and close prices have been swapped
# to trick the function into filling in the candle bodies
AddChart(high = UpH, low = UpL, open = UpC, close = UpO, type = ChartType.CANDLE, growcolor = Color.UPTICK);
# solid red
AddChart(high = DnH, low = DnL, open = DnO, close = DnC, type = ChartType.CANDLE, growcolor = Color.DOWNTICK);
# outline green candles
AddChart(high = UpH, low = UpL, open = UpO, close = UpC, type = ChartType.CANDLE, growcolor = Color.BLACK);
# outline red candles
AddChart(high = DnH, low = DnL, open = DnC, close = DnO, type = ChartType.CANDLE, growcolor = Color.BLACK);
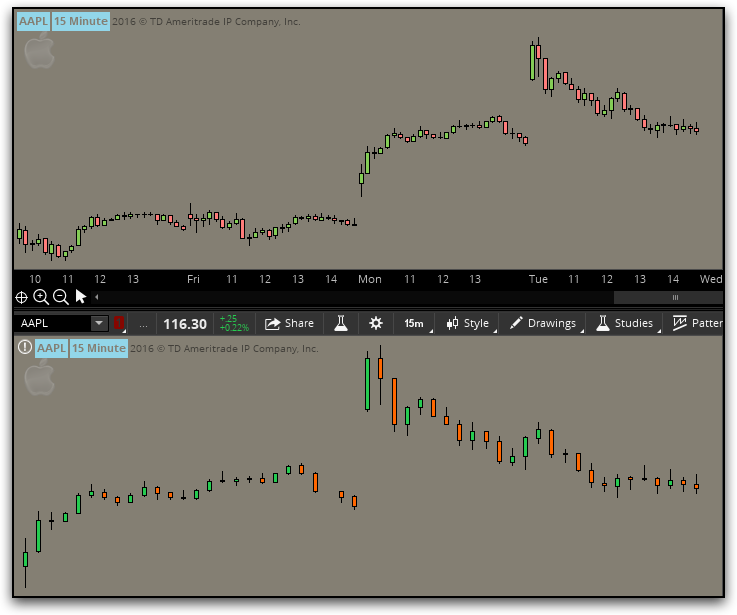
Perfection!!


