
Murrey Math Indictor
“Anything traded publicly is predictable down to 1/8th of
something.”
The Murrey Math indicator is based on T. H. Murrey’s book—which was, itself, based upon the observations made by W. D. Gann in the first half of the 20th century. While Gann was purported to be a brilliant trader in any market, his techniques have been regarded as complex and difficult to implement. The great contribution of T. H. Murrey was the creation of a system of geometry that can be used to describe market price movements in time. T. H. Murrey introduced his “Murrey Math Trading System” in Trader’s World Digest issue #21.
A trader recently asked, “Robert, do you have any scripts that predict ahead of time where a bounce or resistance spot on a daily chart might be? example ABNB”
That is precisely what the Murrey Math indicator is designed to do.
The indicator will calculate 9 important price action levels that form a square in time, as well as, 2 expansion levels above and below the square. Those fixed levels are then projected out 64, 32, or 16 days depending on the settings chosen.
A quick online search will yield page after page of people speculating how the levels are calculated. All the assumptions are based on 2nd or 3rd hand information at best. To write this indicator, I went to the source by tracking down an original copy of T. H. Murrey’s self-published trading manual. The manual includes about 250 pages of instruction and more than 300 example charts.


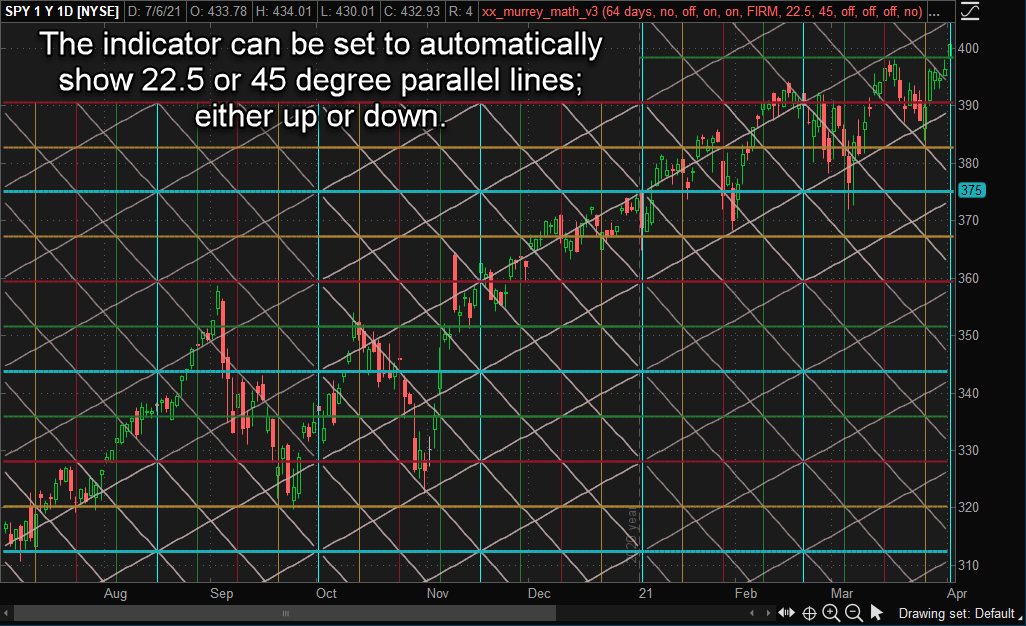

From within the settings panel, box size can be set to 64, 32, or 16 days; circles of conflict, parallel lines, speed lines, and triangle lines can be turned on or off; the parallel line angle can be set to either 22.5 or 45 degrees; and colors can all be adjusted in the “Globals” section.
