Goldbach Levels: Mathematical Price Levels for Thinkorswim
A few months ago, a fellow trader asked me if I had a Goldbach indicator. I had never heard of Goldbach before, so I started researching it.
What I discovered was both fascinating and useful. This led to the development of the Goldbach Levels indicator for Thinkorswim.
What Goldbach Levels Does
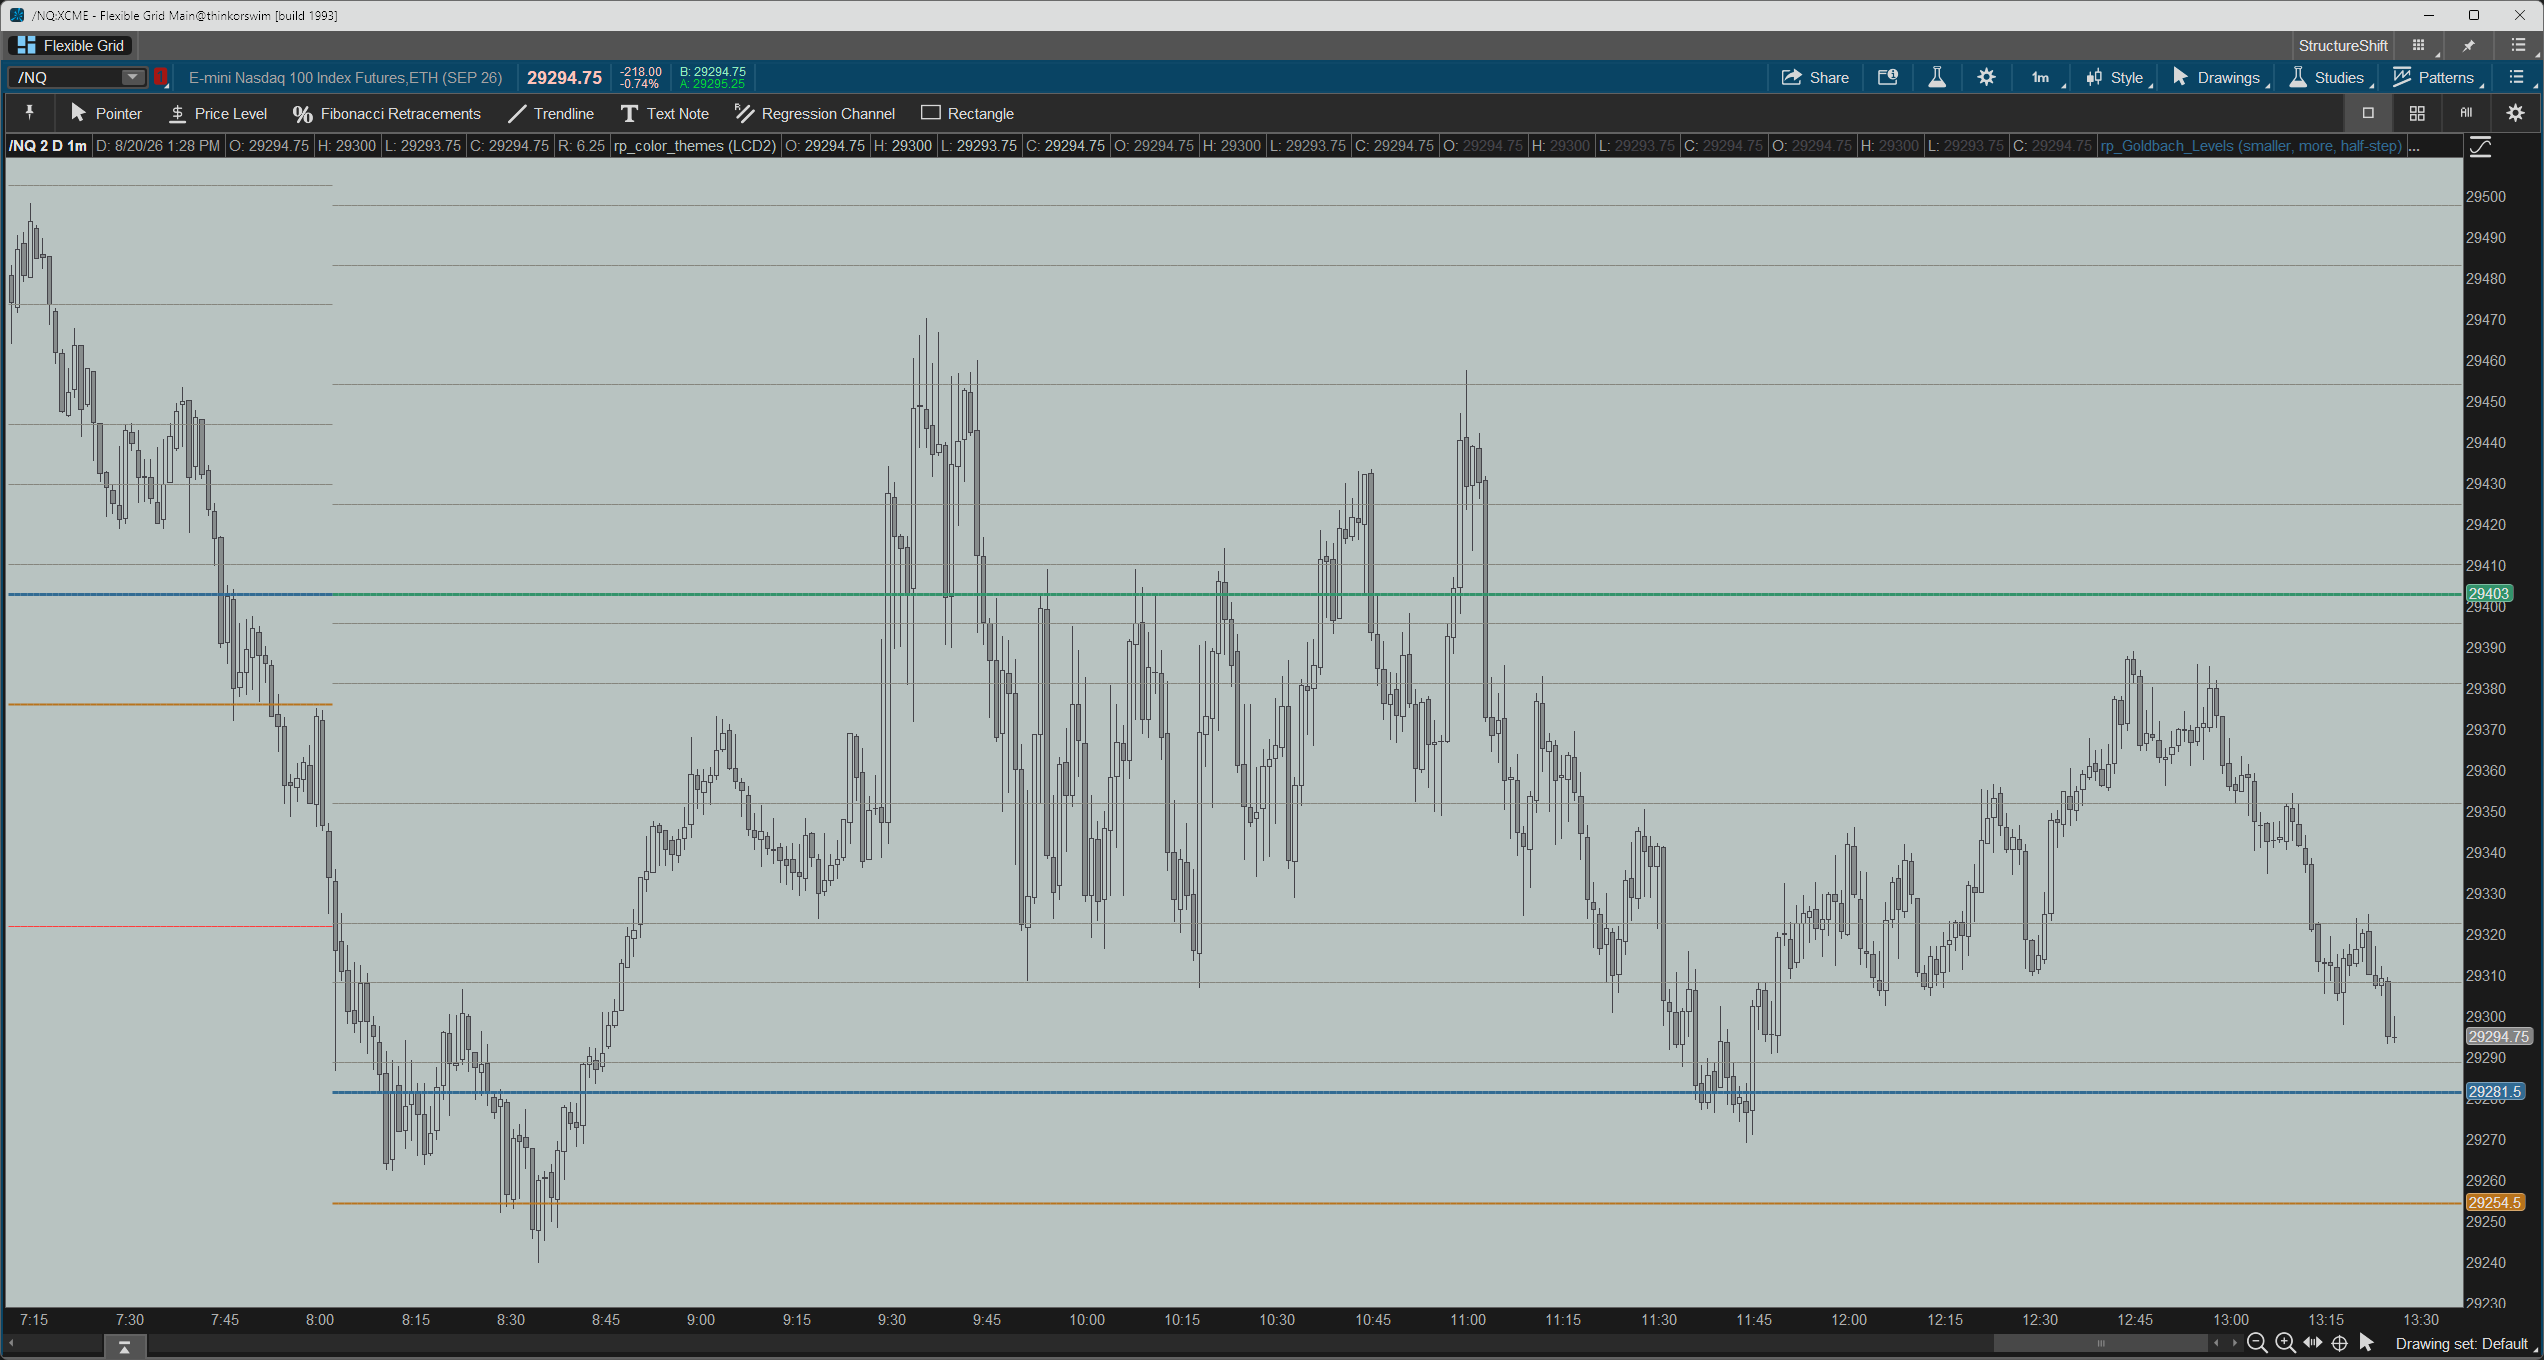
Goldbach Levels identifies a series of mathematically derived price levels and plots them directly on your chart.
These levels can provide potential areas of support and resistance, price targets, and areas where you may want to pay particular attention to what price is doing.
Unlike traditional support and resistance, these levels aren’t based on previous highs and lows. They are calculated mathematically, giving you objective price levels to watch before price gets there.
Why It’s Useful
If you’re looking for a trade, a Goldbach Level can give you a potential area to watch for a reaction. If you’re already in a trade, the levels can provide potential profit targets. And if price is approaching a level, you know exactly where to start paying attention.
The real value comes from combining Goldbach Levels with the other information you’re already using. A Goldbach Level that coincides with a previous high or low, VWAP, Fibonacci level, or another significant price area can provide useful confluence.
Why Traders Use It
- Objective: levels are calculated mathematically rather than drawn by eye.
- Forward-looking: levels are available before price reaches them.
- Flexible: use them for potential support, resistance, reversals, or price targets.
- Confluence: combine Goldbach Levels with the other tools in your trading strategy.
Goldbach Levels isn’t designed to tell you when to buy or sell. It’s designed to tell you where to look.
A Different Way to Look at Price
Most technical analysis tools use some form of market history to determine where price may be important. Previous highs and lows, moving averages, VWAP, Fibonacci levels, pivots—all of them give you a different way of looking at the same market.
Goldbach Levels takes a completely different approach. Instead of starting with recent price action, it uses mathematical relationships to identify the levels.
That makes it particularly interesting when a Goldbach Level lines up with something you’re already watching. When two completely different methods point to the same price, that’s an area worth watching.
Introductory Price: $79
Get Goldbach Levels for just $79 during the introductory period. This special price is available for the first week only.
The regular price of $149 takes effect on August 27, 2026.
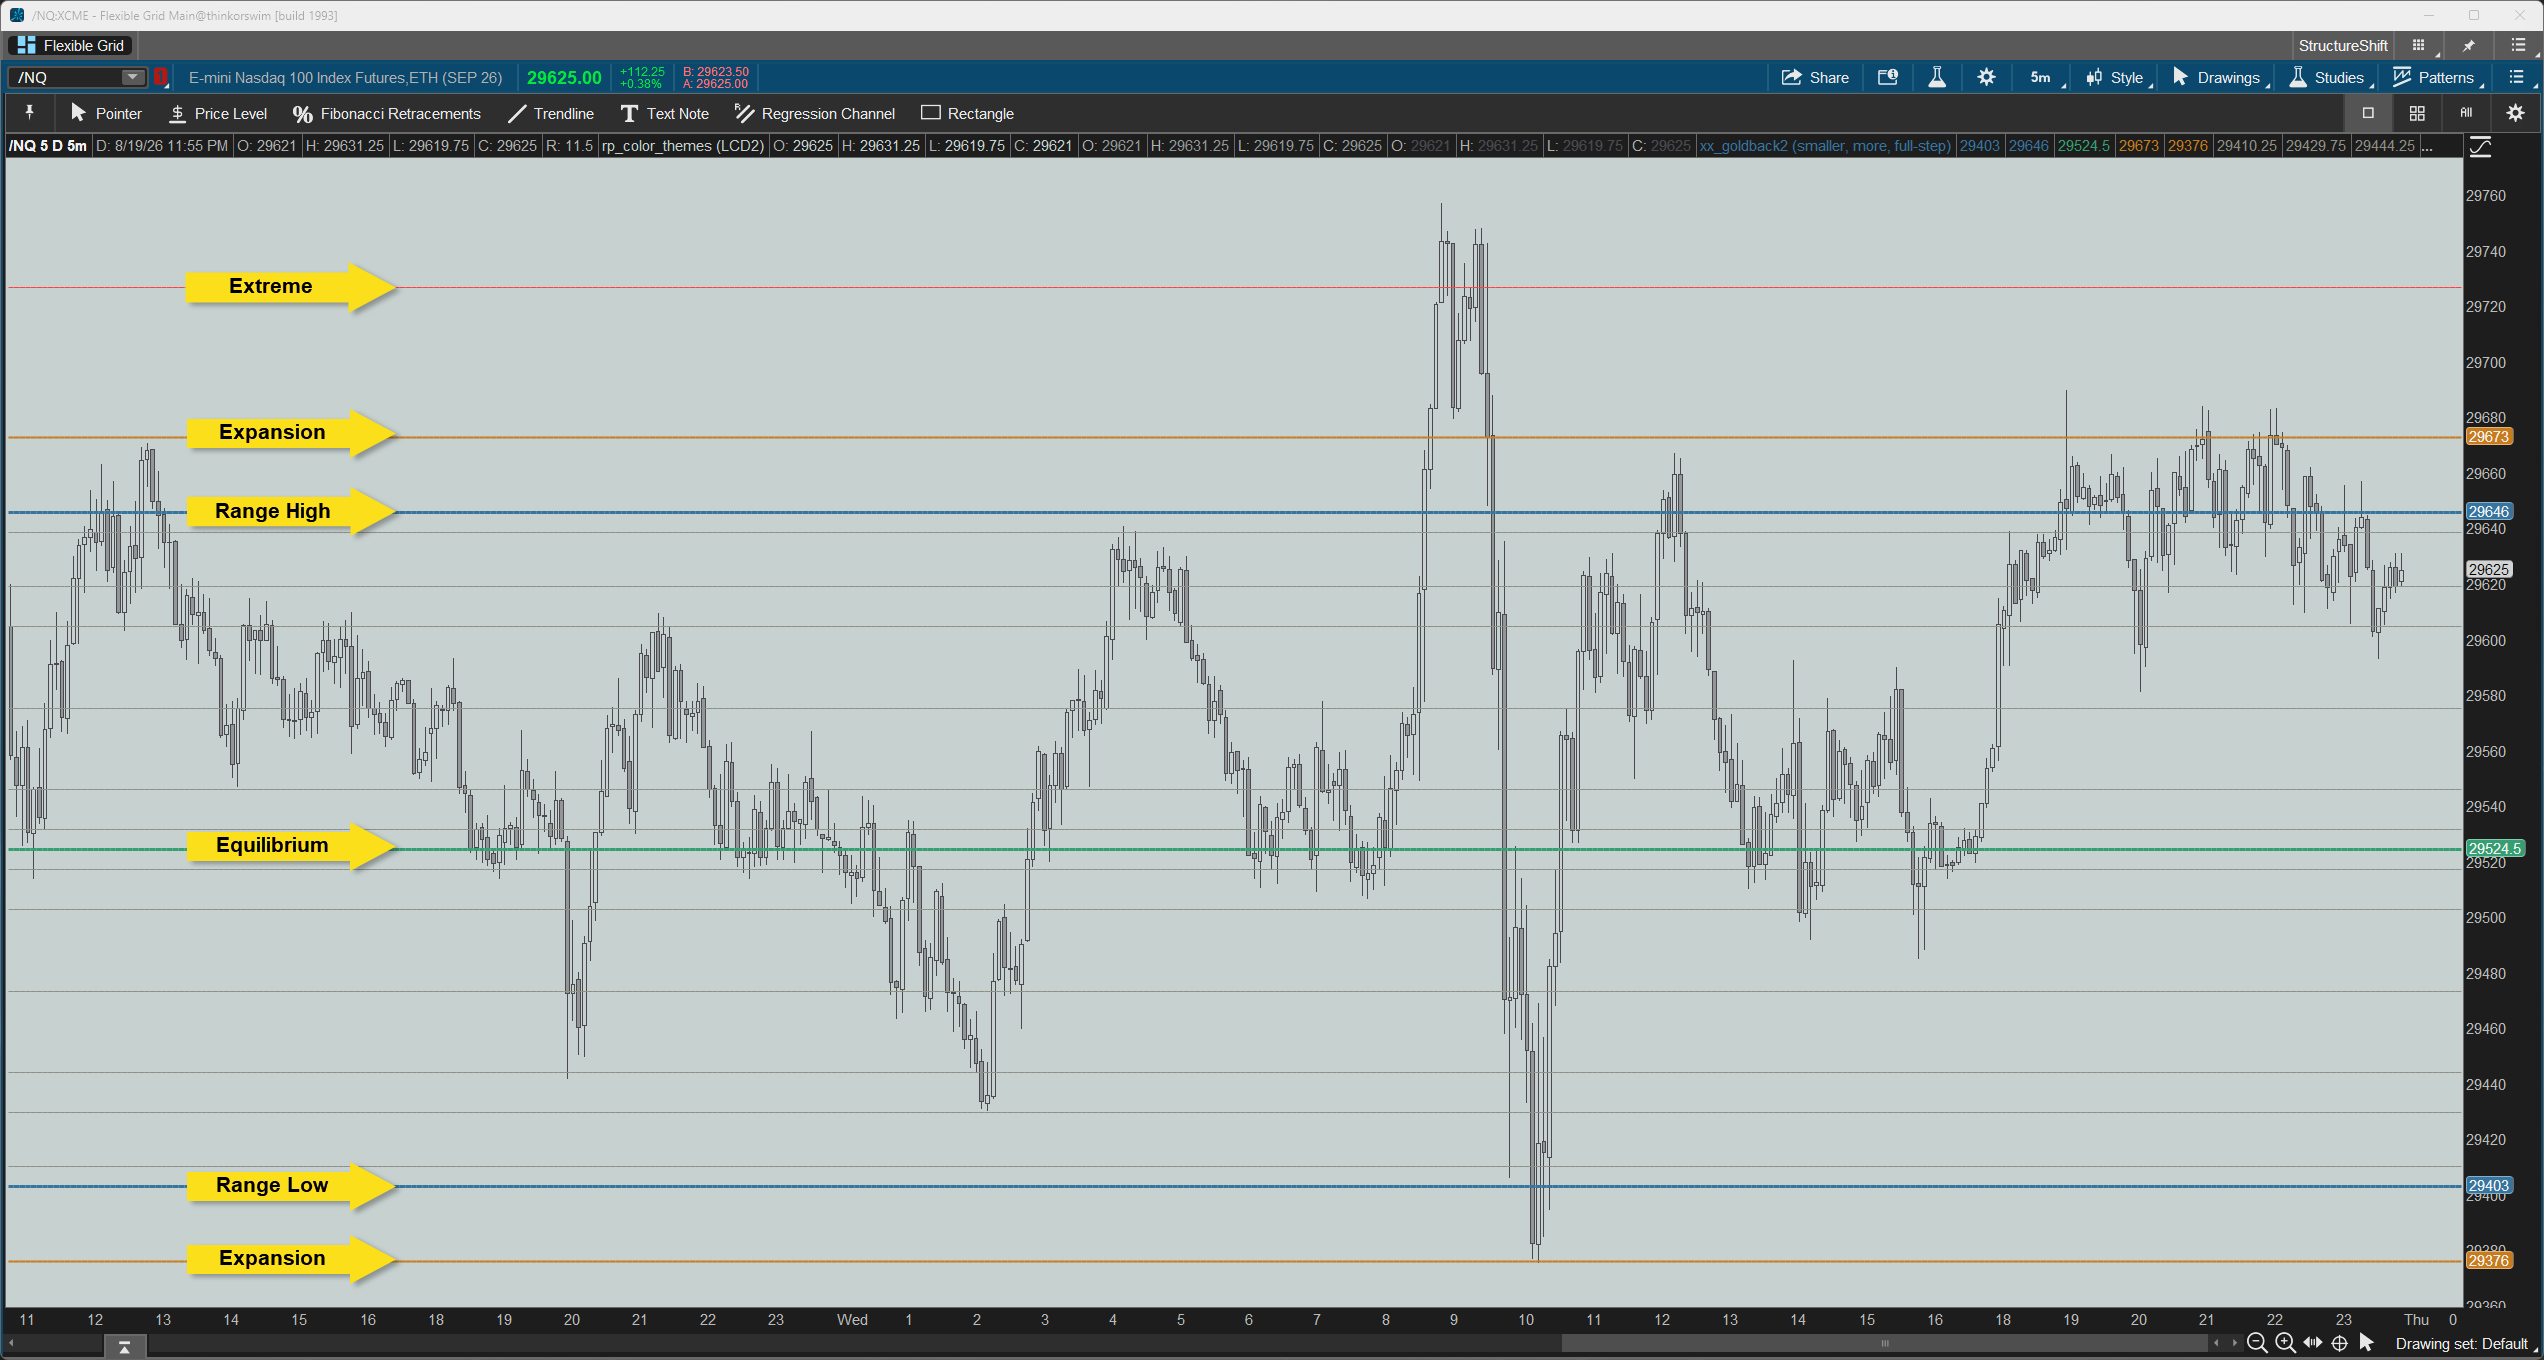
The screenshot above is /NQ from yesterday and last night’s overnight session. Below is a continuation taken just a moment ago during today’s session.
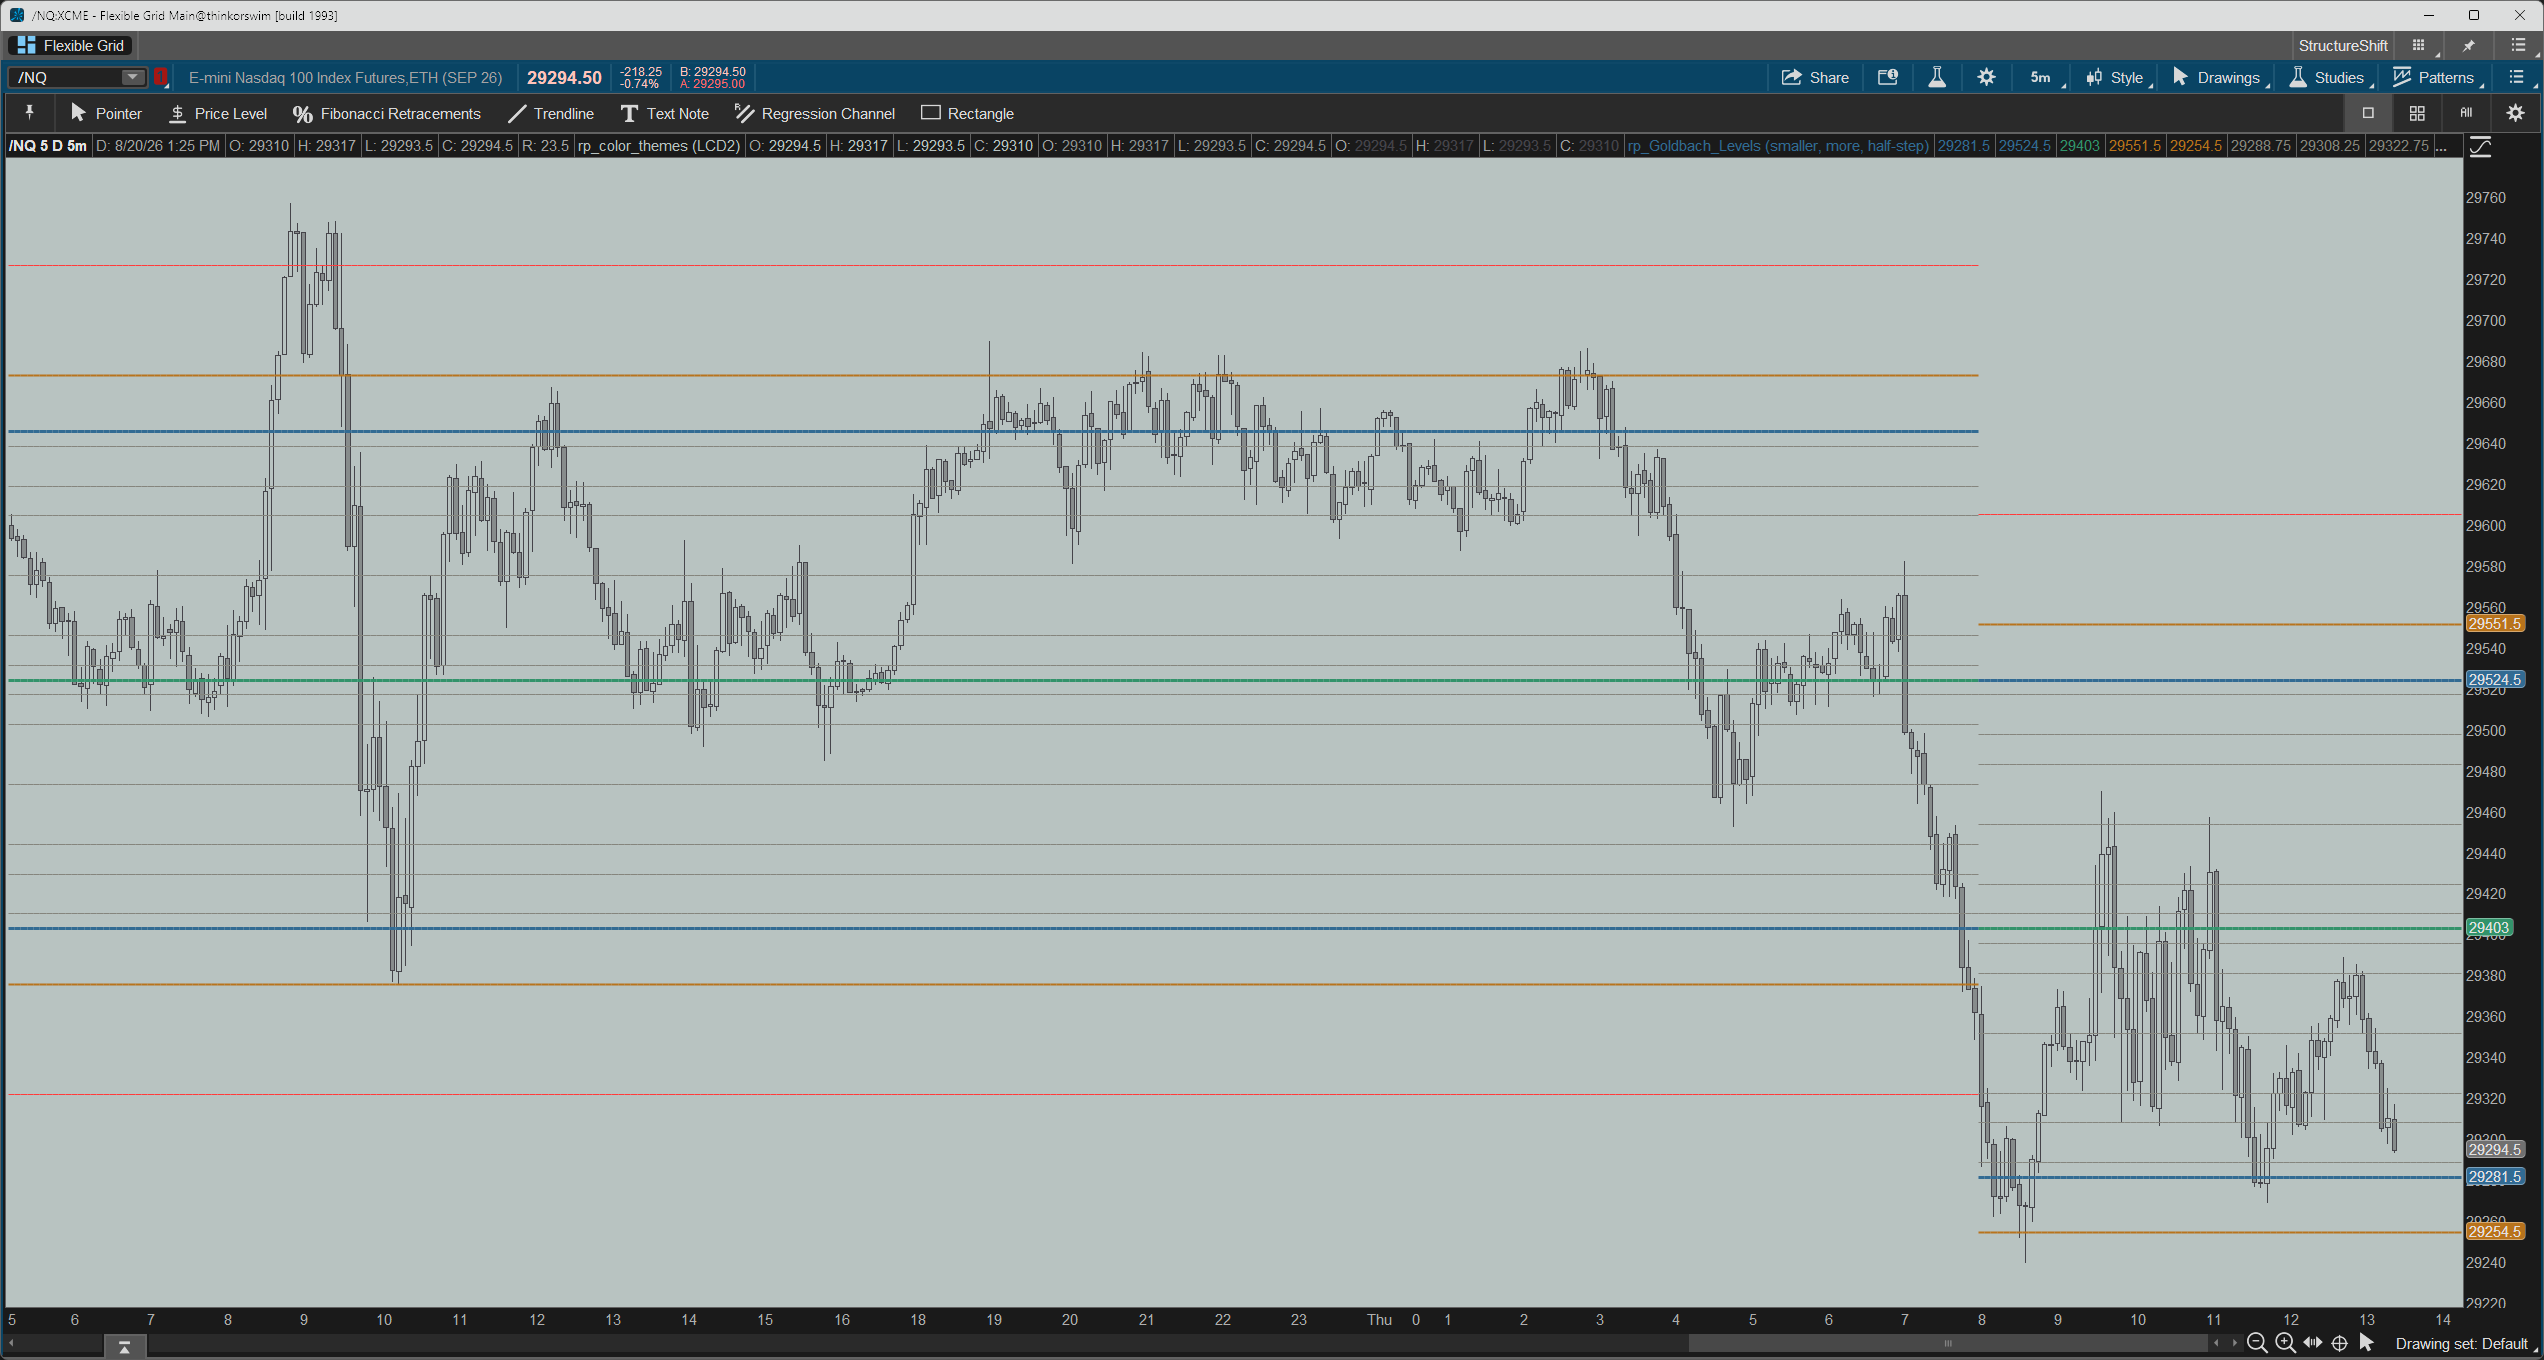
Below is a zoomed in view of the 1 minute chart from today’s session. Generally, you want to look for confluences from your other indicators / trading methodologies to trade toward equilibrium. So, if below the green line, look for longs; above, look for shorts.