
Thinkorswim Doesn’t Have a Line Break Chart. Now It Does.
Thinkorswim offers several ways to display price action, including traditional candlesticks, Heikin Ashi, Equivolume, and range charts. But one popular Japanese charting method is conspicuously absent: the Line Break chart.
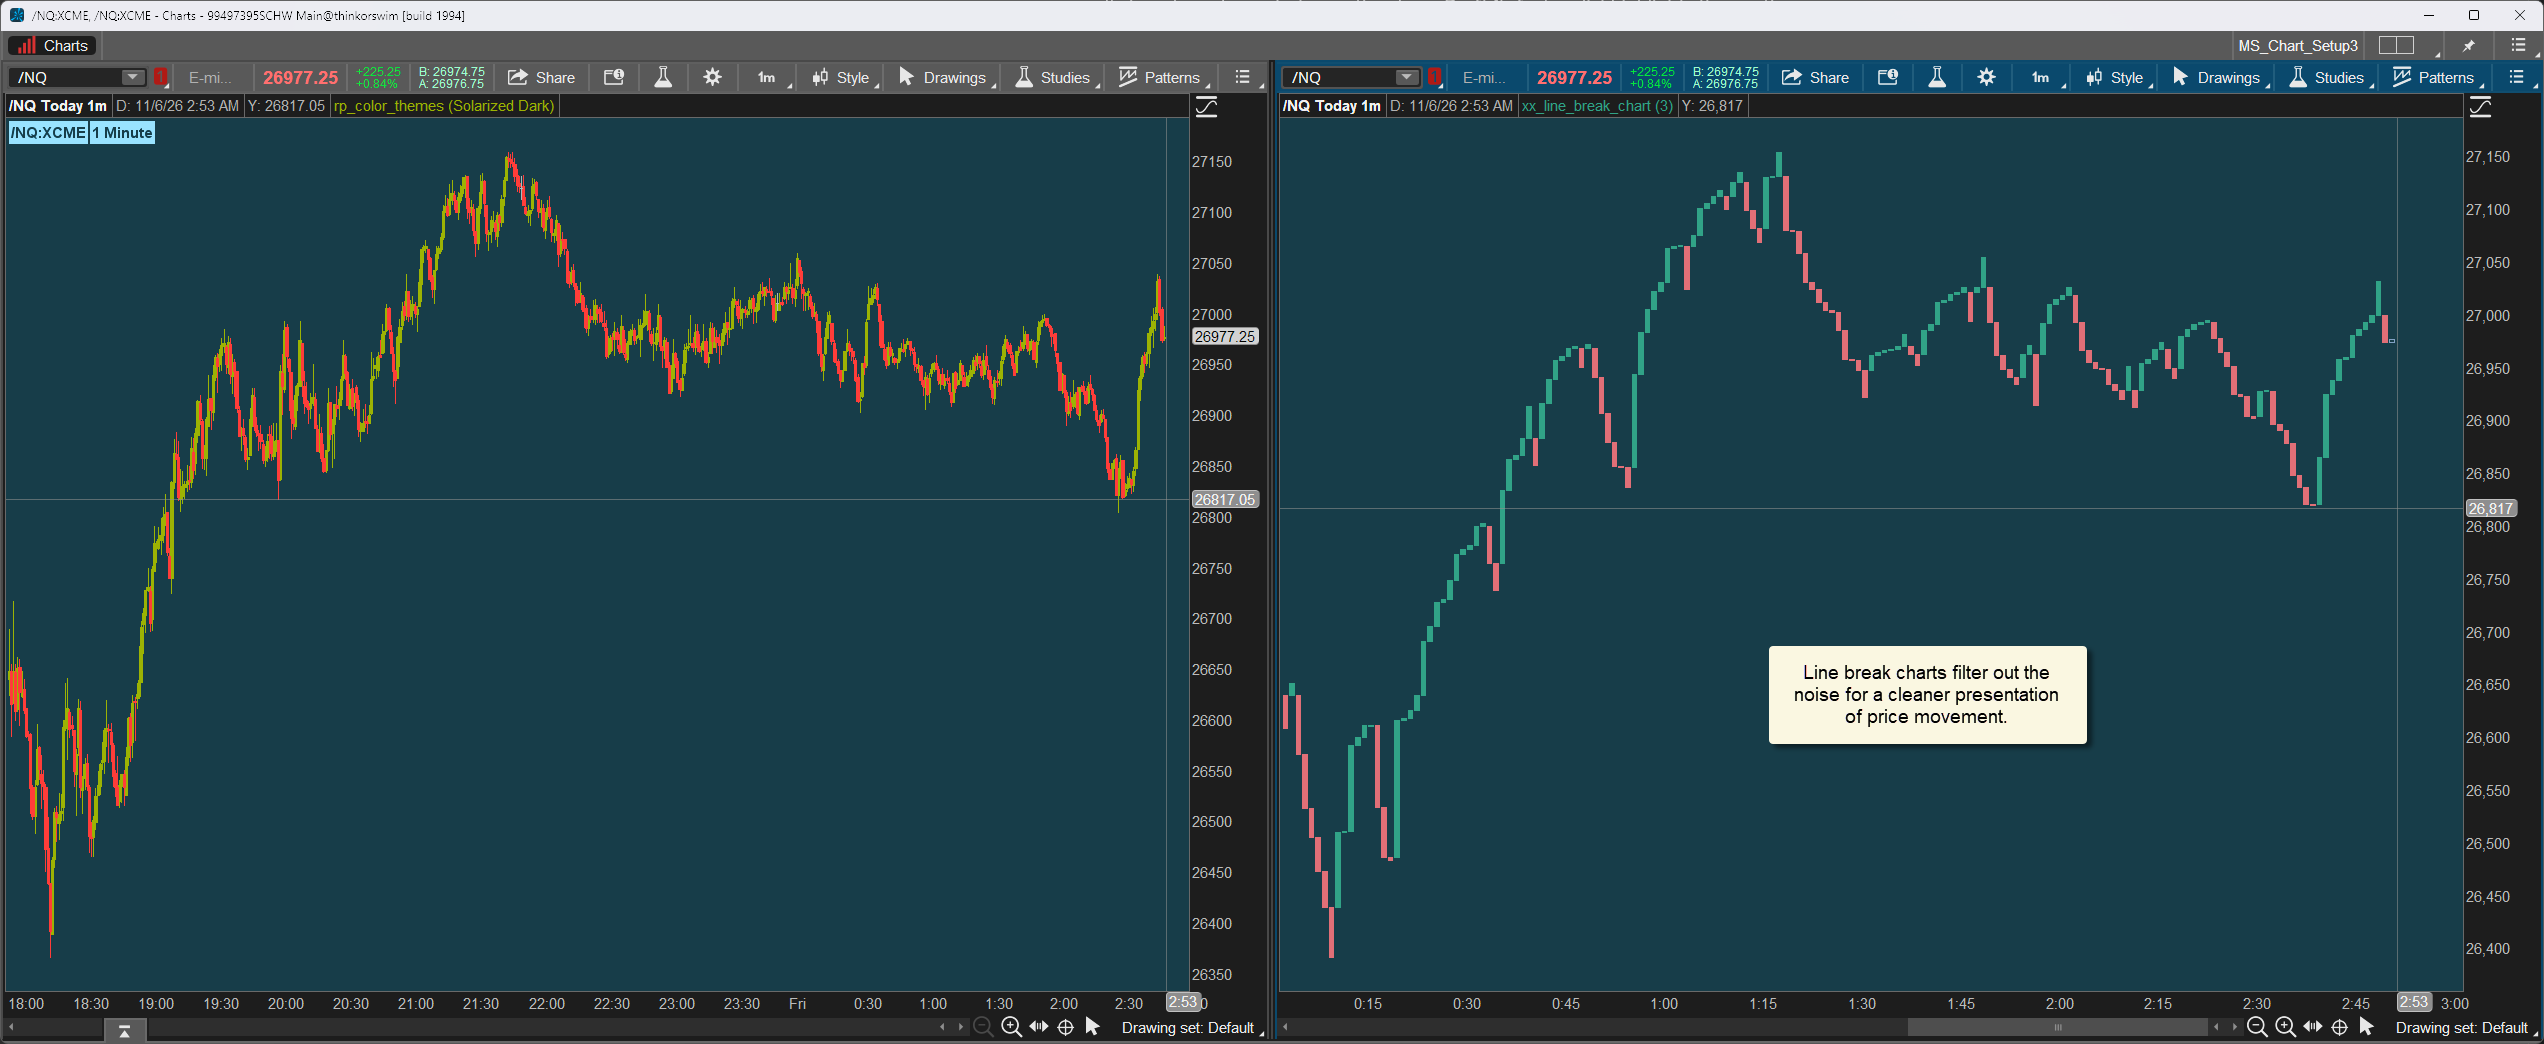
If you’ve ever stared at a 5-minute chart trying to determine whether a pullback represents a potential reversal or just intraday chop, Line Break charts offer a different perspective—one driven by price movement rather than fixed time intervals.
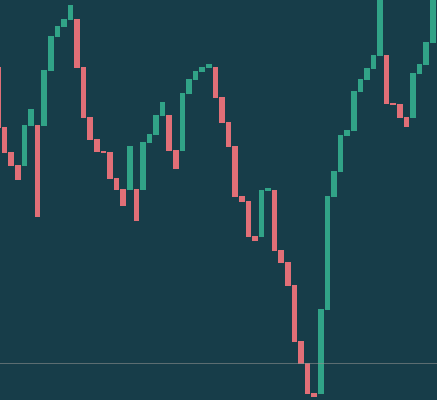
How a Line Break Chart Works
Originating in Japan, Line Break charts remove the time-based spacing between chart elements. A new vertical line is drawn only when closing prices satisfy defined thresholds:
- Continuation: If price closes beyond the high or low of the previous line in the prevailing direction, a new line forms.
- Reversal: To reverse direction, price must close beyond the opposite extreme of the previous three lines (the classic “Three-Line Break”).
- Chop / Inaction: If price stays within those boundaries, no new line is drawn—regardless of how many minutes or hours pass.
The result is a clean, continuous representation of price movement that filters out fluctuations that don’t meet the chart’s continuation or reversal criteria.
Why Traders Use It
- Objective trend definition: Sustained trends appear as uninterrupted runs of same-color lines. Minor countertrend movements don’t interrupt the sequence unless price satisfies the reversal criteria.
- Rules-based reversal thresholds: Reversal lines require closing prices to cross defined extremes of previous lines, providing an objective method for identifying potential changes in trend direction.
- Defined price reference points: The highs and lows of recent lines provide identifiable price levels that traders can consider when evaluating potential reversals, stop placement, and trade management.
- Less visual clutter: Sideways consolidation that might produce dozens of traditional candlesticks can pass without generating a single new Line Break line.
Built Specifically for Thinkorswim
Thinkorswim doesn’t natively support Line Break charts, and its bar-based plotting system presents some unusual challenges when displaying price-driven chart structures.
The Line Break Charts for Thinkorswim indicator overcomes those limitations by reconstructing a continuous Line Break chart directly inside Thinkorswim.
- Continuous, right-aligned display: Lines are arranged sequentially against the right edge of the chart, eliminating the time gaps between qualifying price movements.
- Live, developing line: A separately colored, unconfirmed line displays current price movement alongside the completed Line Break chart, providing an up-to-date view before the next line is established.
- Adjustable reversal sensitivity: Use the classic three-line lookback or choose from 2 to 6 lines to control how readily the chart responds to potential trend reversals.
- Distinct bullish and bearish lines: Color-coded lines make the prevailing direction and potential directional changes easy to recognize.
- Direct Thinkorswim integration: Explore Line Break price behavior without leaving your existing trading workspace.
The Tradeoff
Line Break charts are lagging, trend-following tools. Because a reversal requires price to cross the extremes of previous lines, confirmation occurs only after the market has already moved.
Longer reversal lookbacks generally filter more countertrend movement, but they can also delay recognition of potential reversals. Shorter lookbacks respond more readily but may produce more frequent directional changes.
And in choppy markets, even confirmed Line Break reversals can be followed by moves in the opposite direction.
This is a structural lens for your price action, not a standalone automated trading system.
Add Line Break Charts to Your Thinkorswim Setup
No platform switching. No secondary charting subscriptions. Just genuine Line Break charting, right inside your existing Thinkorswim workspace.
Introductory offer: Line Break Charts for Thinkorswim is available for just $128 for the first week. The price returns to the regular $149 on 13 November 2026.
A Short Introduction to Line Break Charts
Trading involves risk. This indicator is an analytical tool, not financial advice.