
Major Update: 22 Jan 2026
The biggest update yet.
Version 3 has been re-built from the ground up. It includes many new features including:
- Support for /ES, /NQ, /CL, AND /GC futures
- Works with any stock that has options
- Automatically selects the correct strike interval (no more manually hunting for the right setting)
- Added support for Absolute GEX, Charm, Charm Exposure, Vanna, and Vanna Exposure
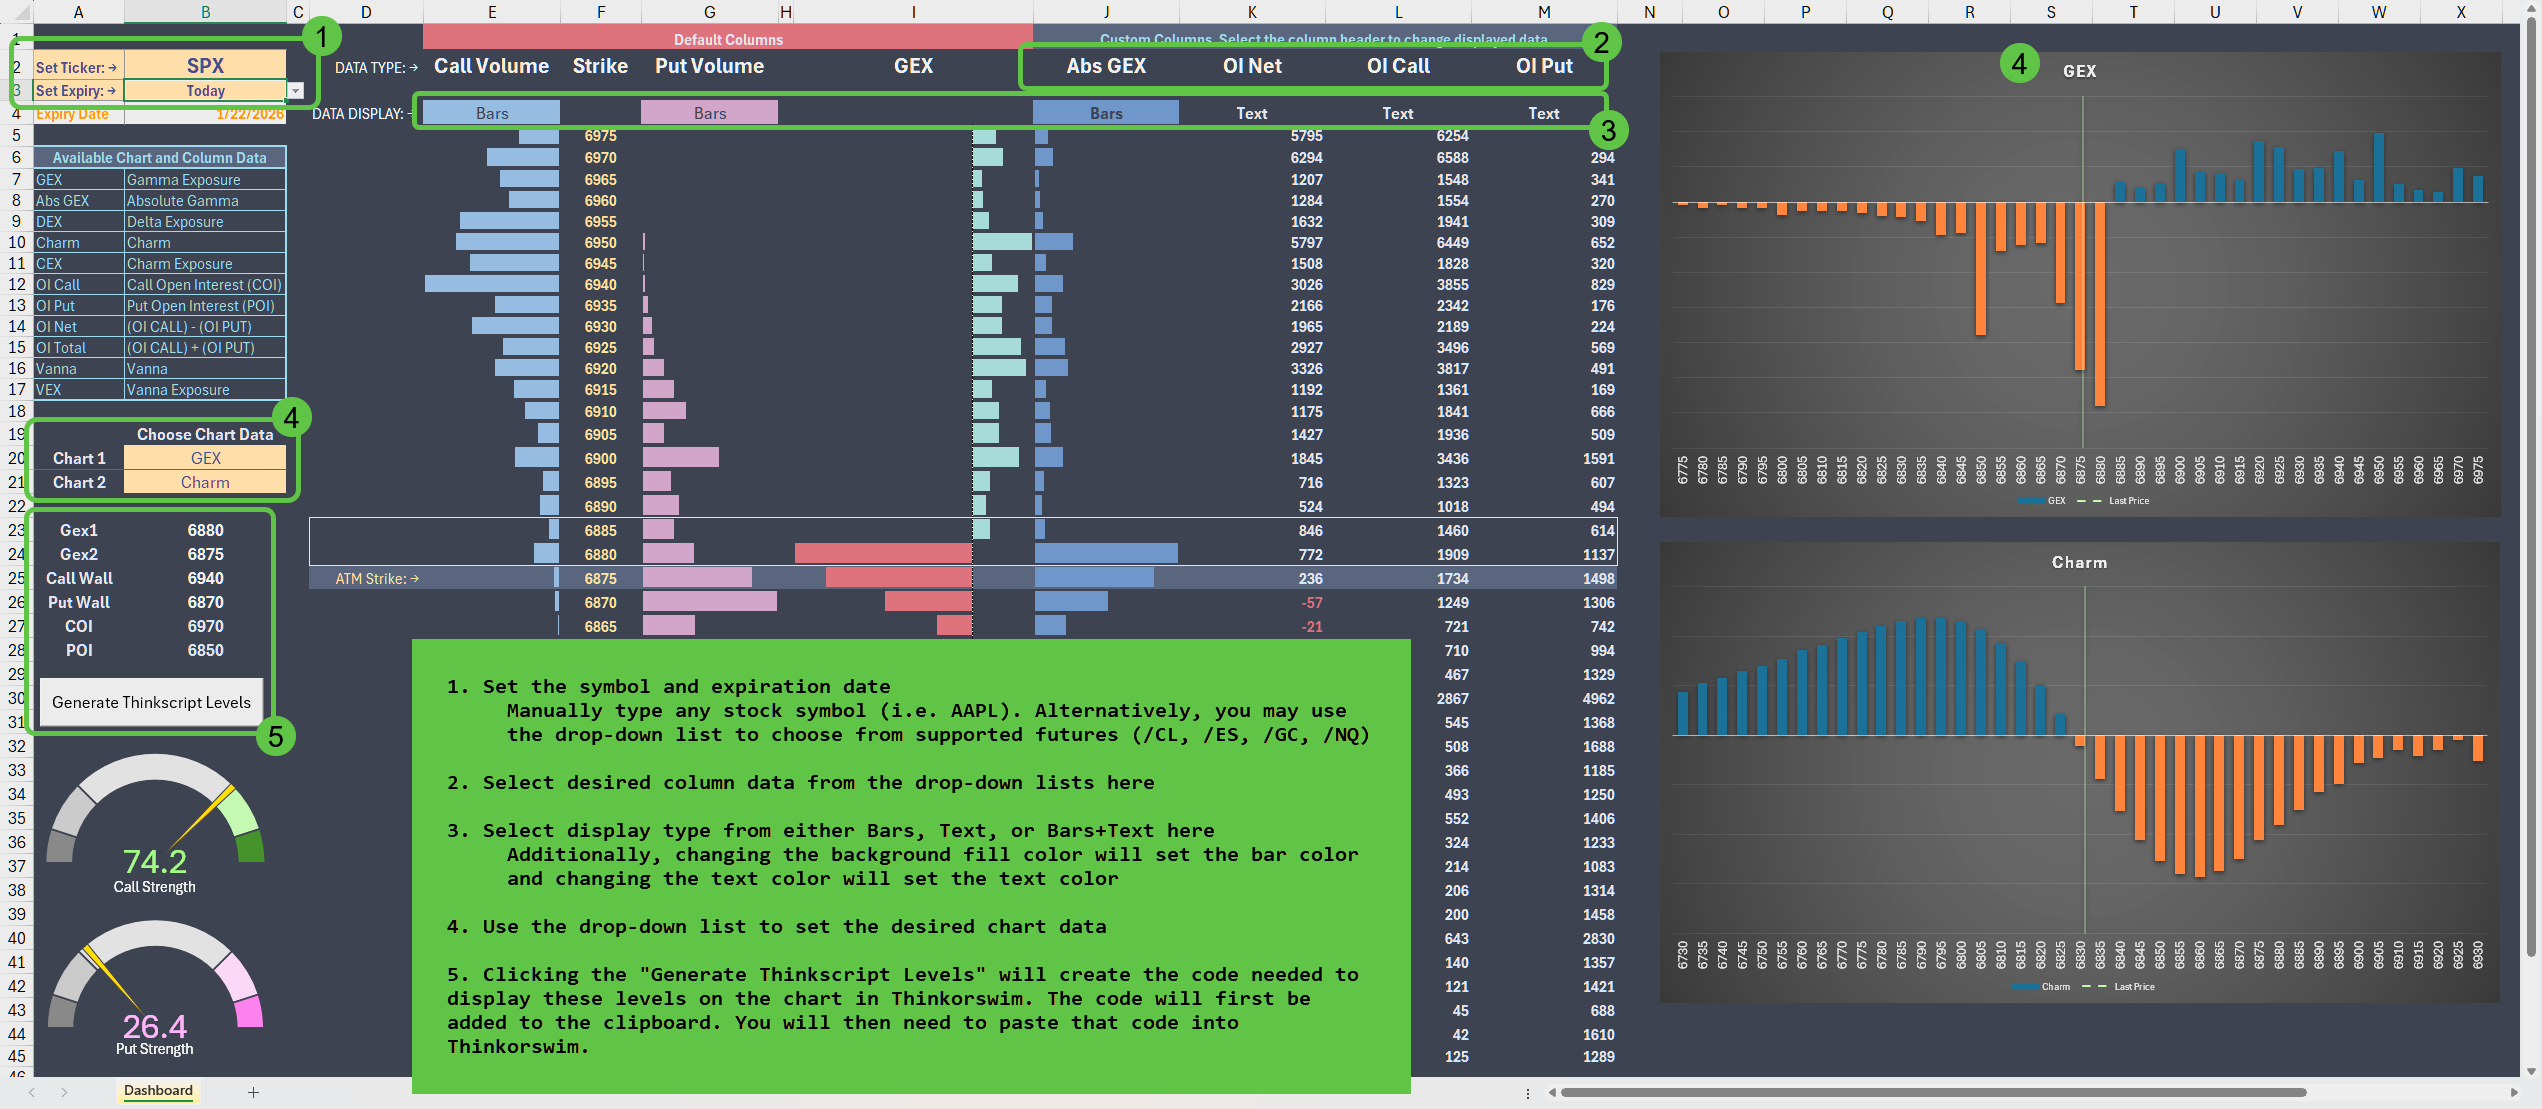
- Customize the spreadsheet to meet *your needs*
- Choose which data to display in 4 user-configurable columns and on 2 graphs
- Column data can be displayed as either bars or text
- Column bars & text colors can be set to your liking
- The two graphs now include a vertical line showing the current price.
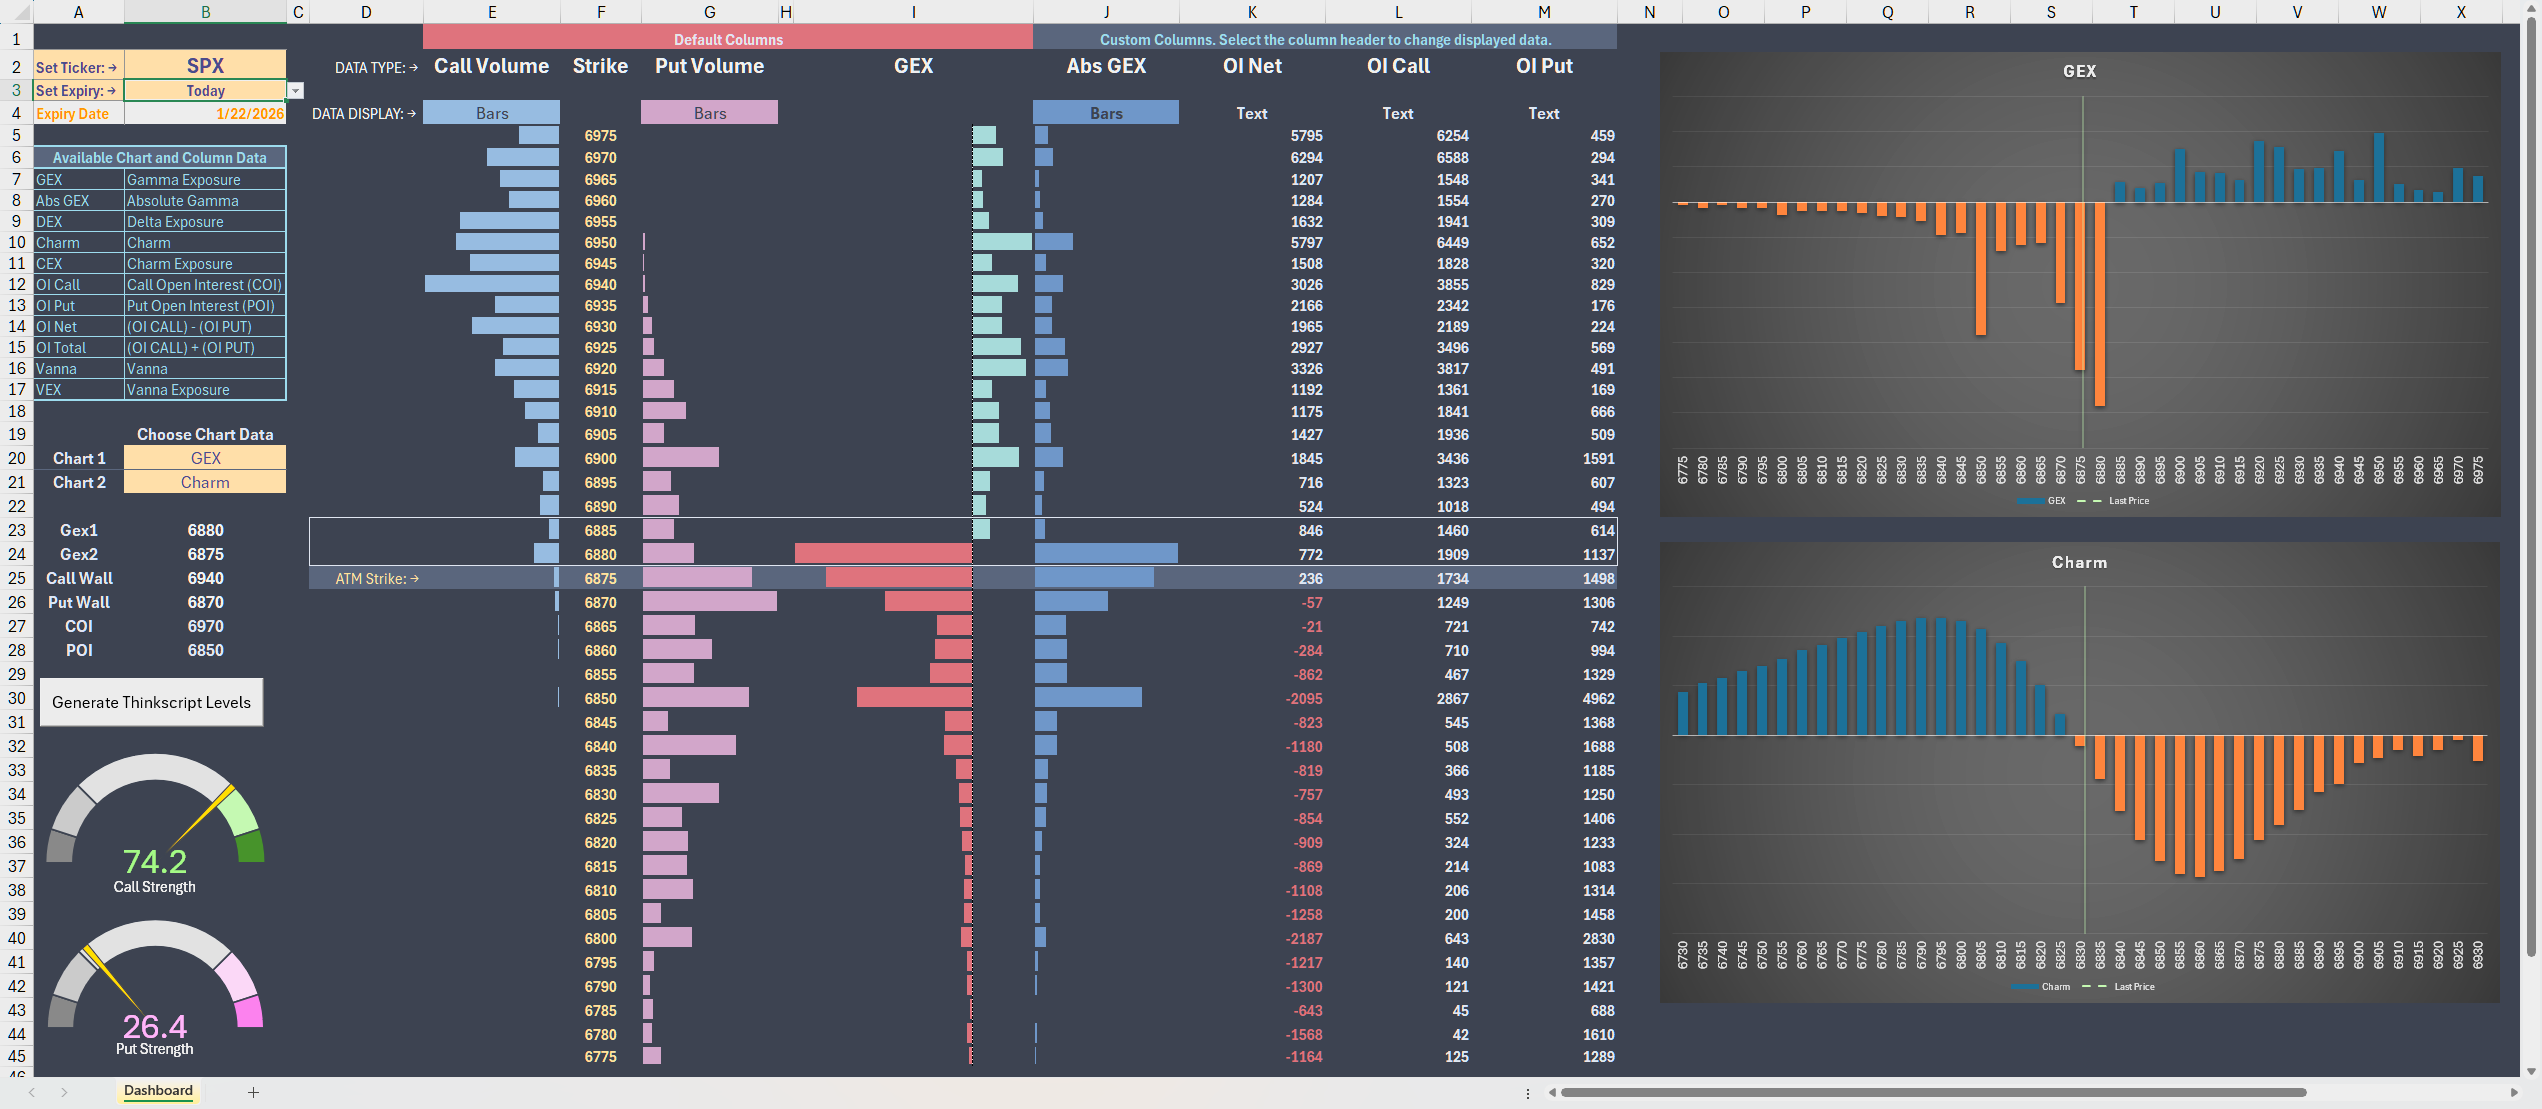
Introducing the SPX Gamma Dashboard: Optimized for 0DTE and Intraday Futures Traders
The SPX Gamma Dashboard is an Excel-based tool specifically designed for traders focused on 0DTE options and intraday futures. It offers real-time insights into gamma exposure, open interest, potential call / put walls, and gamma bias. These metrics are essential for identifying key levels where prices may gravitate due to market maker hedging, as well as potential support and resistance zones.
With its clear and intuitive visualizations, the dashboard enables traders to quickly assess critical strike levels, making it easier to respond to market movements in fast-paced environments. The tool also includes gauges for instantly evaluating call and put strength, supporting rapid decision-making in dynamic trading conditions.
A standout feature of the SPX Gamma Dashboard is the ability to generate a Thinkscript indicator for use in the Thinkorswim platform. This allows you to seamlessly overlay key SPX levels on your SPX, /ES, and SPY charts.
For the indicator, start by creating a new indicator in Thinkorswim and add it to your chart. You can name it anything you like—I call mine “SPX Levels.” Next, click the “Generate Thinkscript Levels” button in the spreadsheet. This will automatically create the script and copy it to your clipboard. Then, paste the code into the new indicator you created. Whenever you want to update the levels, simply click the “Generate Thinkscript Levels” button again and paste the new script over the old one in your “SPX Levels” indicator. It only takes a few seconds.
If you don’t like the colors or label names I’ve chosen, you can customize them in the Excel spreadsheet. The “Generate Thinkscript Levels” feature will update the line colors and labels according to your changes.
Personally, I update the chart about five minutes after the market opens and again around midday.
Please note, this tool requires Microsoft Excel for Windows and Thinkorswim. It is not compatible with the Mac version of Excel, as the RTD protocol needed to pull real-time data from Thinkorswim is not supported on that platform.


Update: 13 Sep 2024
The GEX Dashboard spreadsheet has been updated to v1.1 and now includes chart levels for the largest call & put walls.
Update: 25 Apr 2025
By popular request, the highly regarded GEX indicator now includes dedicated QQQ support. Analyze SPX and QQQ with individual spreadsheets—both included with your purchase. Best of all, this update is completely free for existing clients.
Major Update: 25 Jun 2025
Based on user feedback, this update adds support for the VIX.
Major Update: 10 Jun 2025
You asked, and I listened! The latest and most-requested update to the Gamma Dashboard is here. The number one requested feature is here: compatibility with all stock symbols. This major update also ensures a more robust and seamless user experience with enhanced error handling.
Get started today! The SPX Gamma Dashboard is designed to give you a trading edge, whether you’re trading 0DTE options or intraday futures. With real-time data and powerful visualizations, you’ll be ready to act quickly and decisively.