TDST Levels: Rule-Based Support and Resistance That Hold Up
This indicator is based on the TDST (Tom DeMark Setup Trend) developed by Tom DeMark.
If you’d like to understand the original concept in DeMark’s own words, read his explanation in
The New Science of Technical Analysis (John Wiley & Sons).
That short excerpt covers how TDST levels are derived from the highest true high and lowest true low of recent trends to define objective support and resistance.
Why It Exists
Most traders draw support and resistance from swing highs and lows. It works—until it doesn’t. Too many lines, too much subjectivity, and zero consistency.
TDST levels solve that. They give you fixed, rule-based boundaries grounded in actual market structure, not hindsight.
What TDST Does
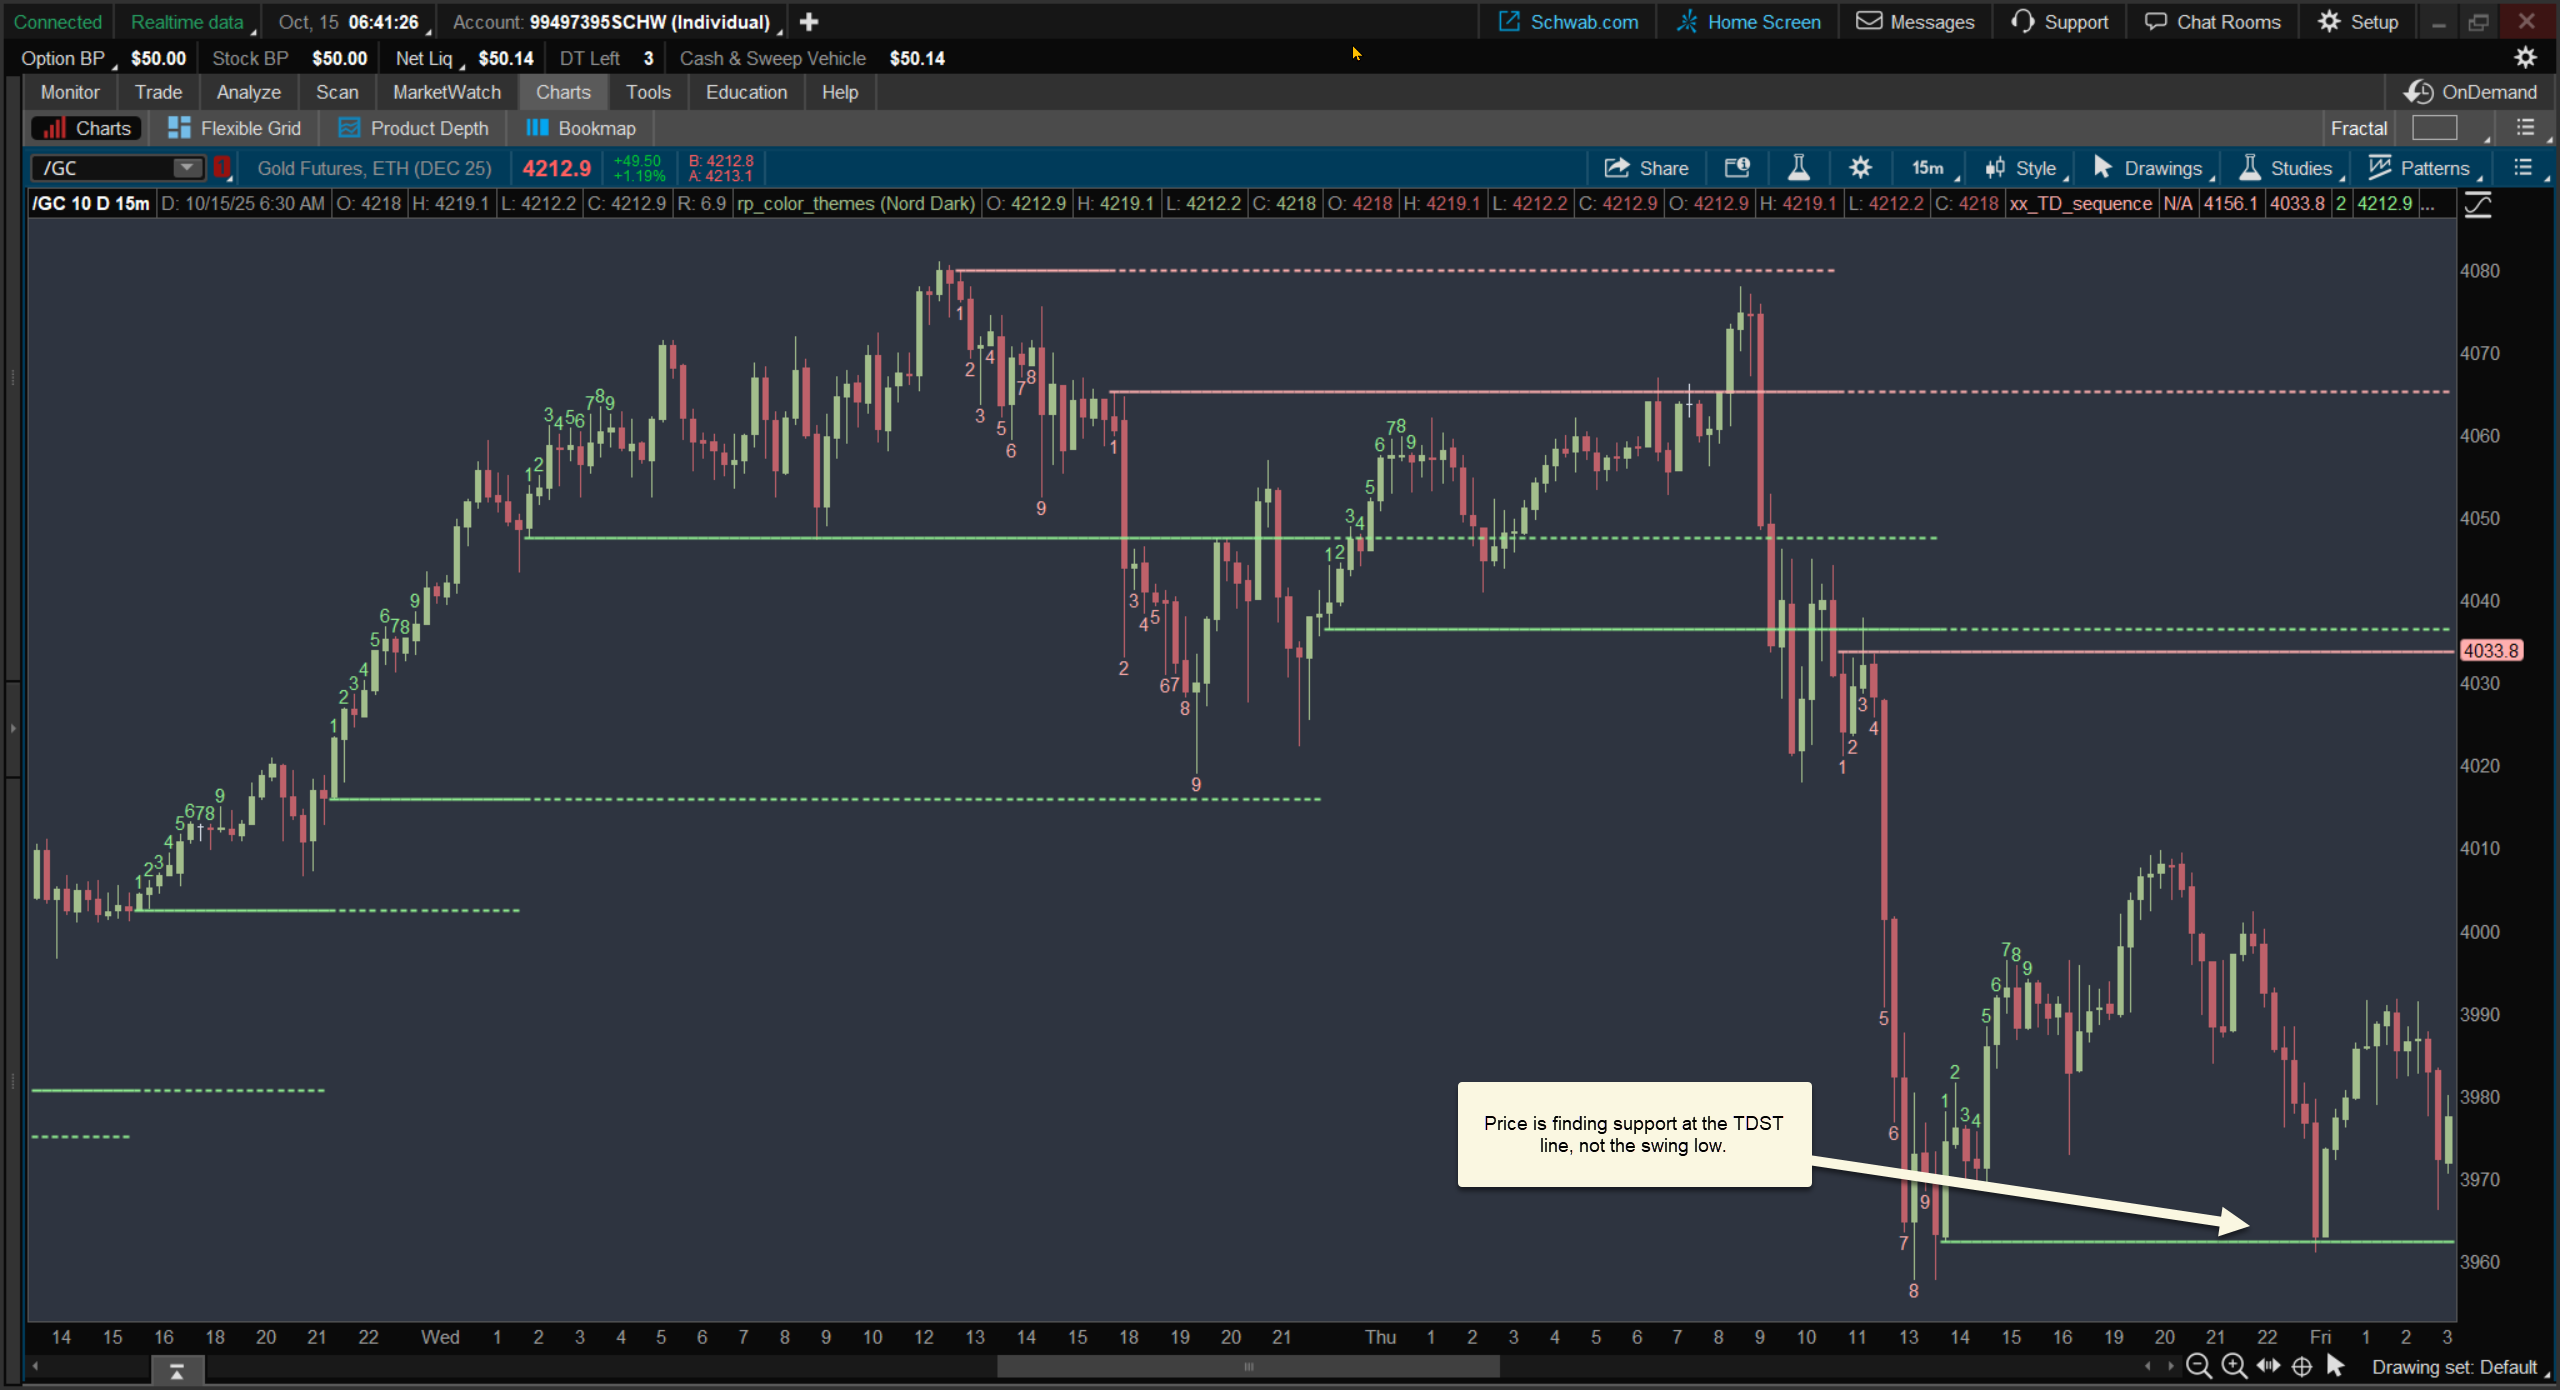
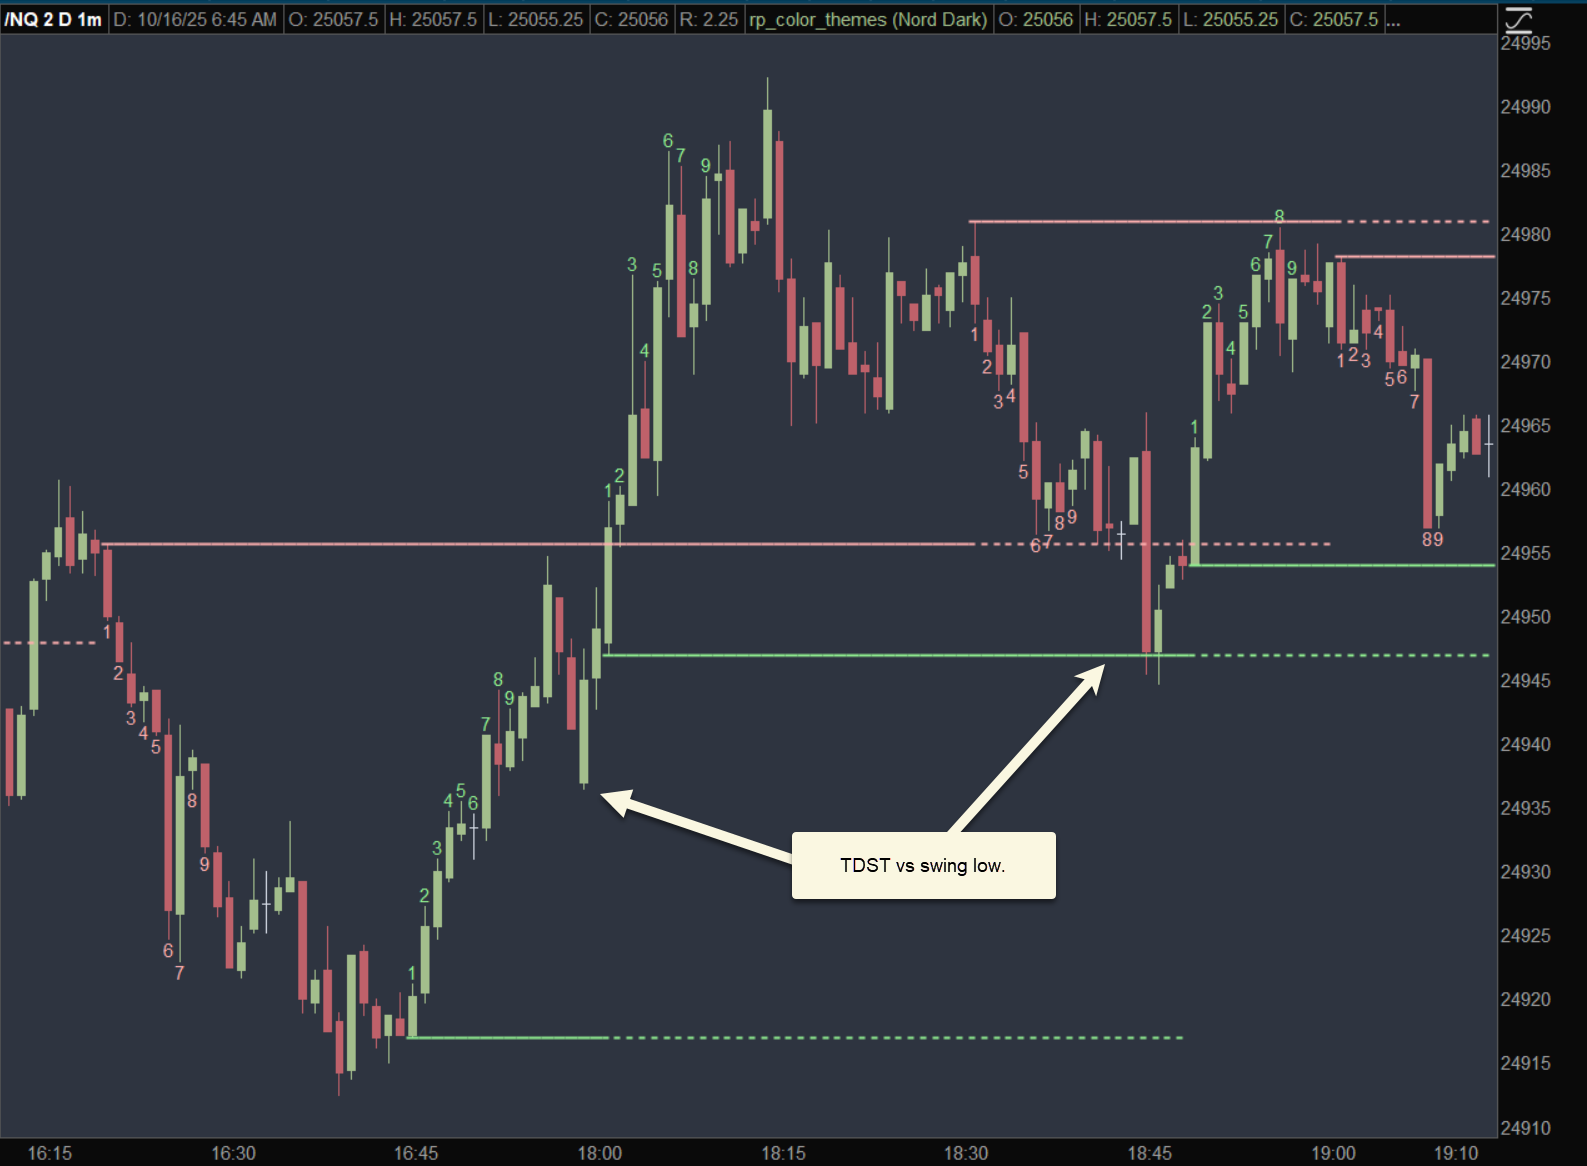
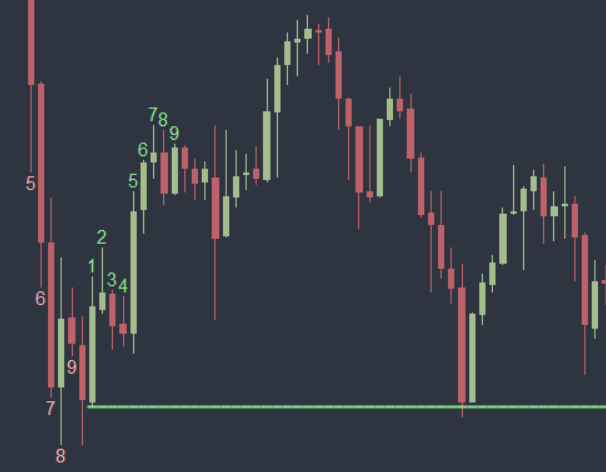
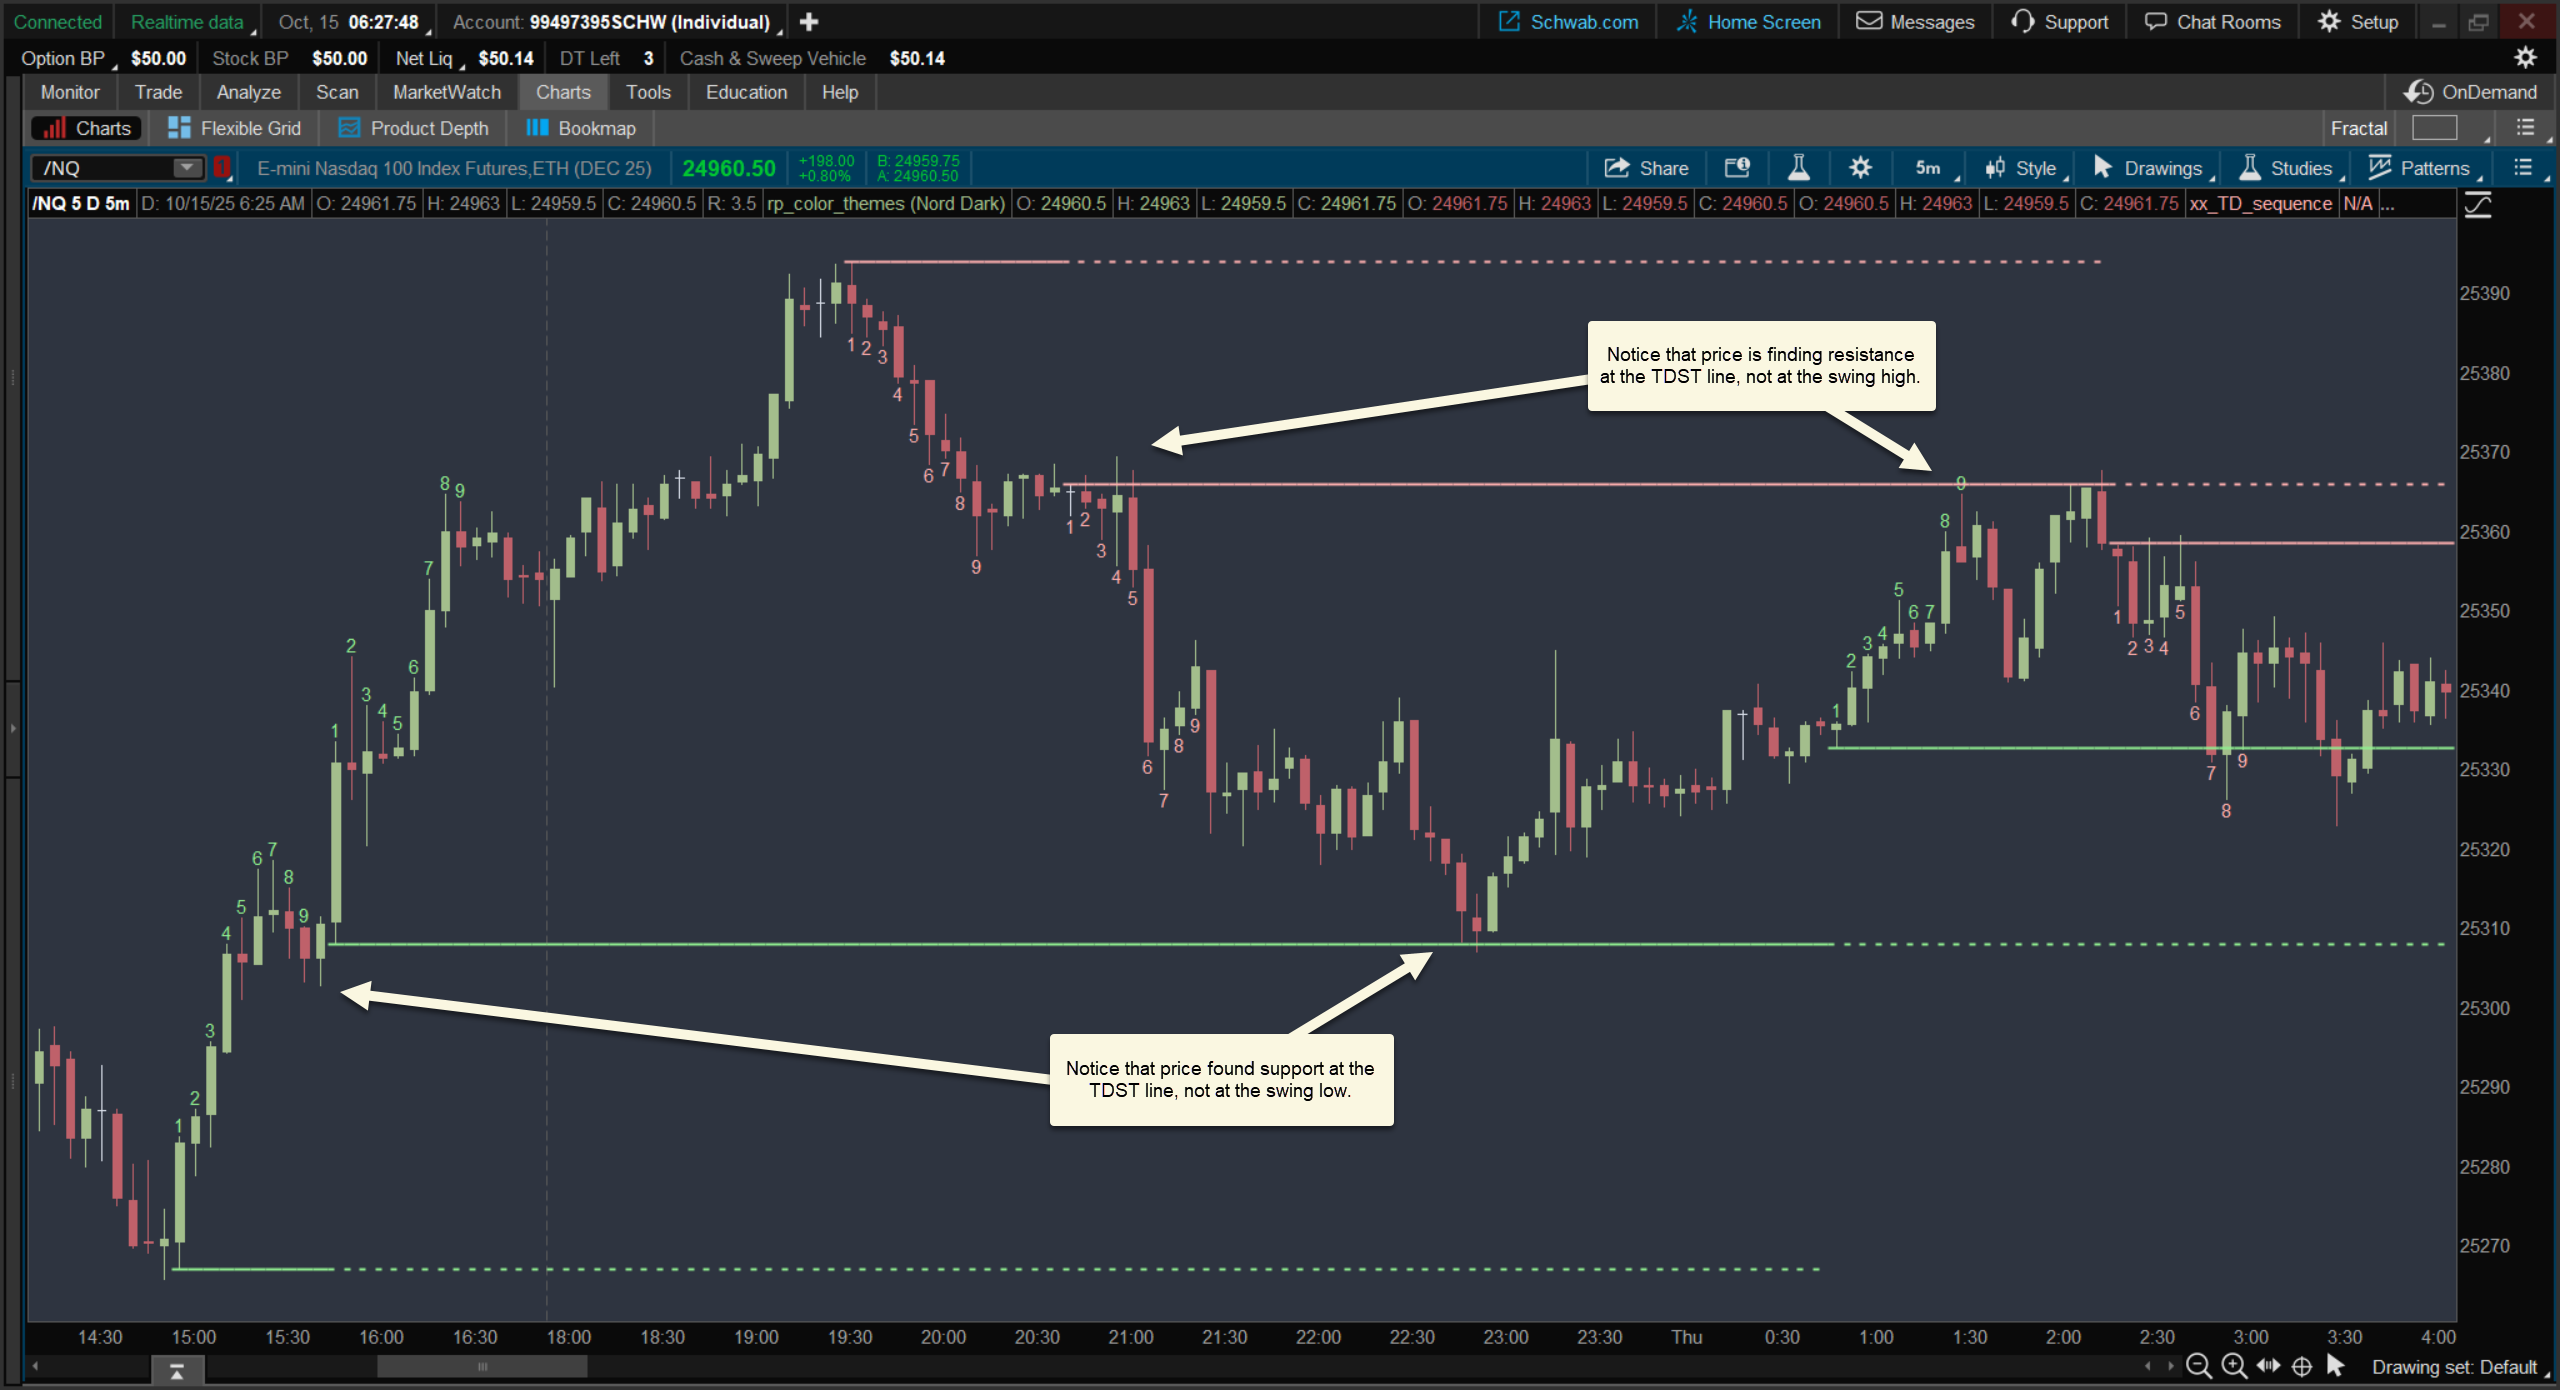
TDST comes from the Setup phase of DeMark’s Sequential framework. It identifies the highest true high and lowest true low of the most recent underlying trend, then locks those values as reference levels.
Those become objective support and resistance. As long as price holds above TDST support or below TDST resistance, the trend stands. Once price closes beyond that boundary, the prior trend is considered broken. Not a touch, not a fakeout—confirmation by close.
Why Traders Use It
- Objective: defined by rules, not opinion.
- Durable: levels stay fixed until decisively closed through.
- Readable: a few clear lines, not a tangle of swings.
- Actionable: a close beyond TDST marks real trend failure or breakout.
TDST levels give you something rare on a chart—clarity.
Why It’s Better Than Swing Highs/Lows
Swing highs and lows are easy to find but hard to trust. Every minor wiggle becomes another “level,” and no two traders draw them the same way.
TDST filters all that noise. It highlights only the true extremes that define the structure of the last trend. The result: fewer lines, stronger signals, and a cleaner read on market intent.